Super Store Sales Analysis – USA
تفاصيل العمل
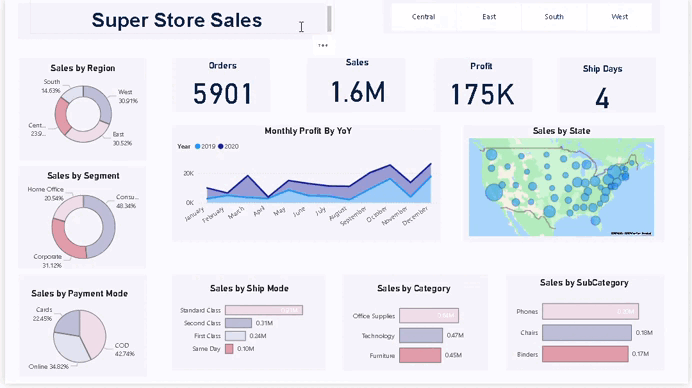
developed a Power BI dashboard to analyze retail sales performance in the US.
It highlights:
. Overall orders, sales, profit, and shipping days
. Sales distribution by region, segment, and payment mode
. Monthly profit YoY trends for 2019 vs 2020
. Sales breakdown by category, subcategory, and ship mode
. Geographical insights with sales by state
This project was a great opportunity to apply data cleaning, modeling, and visualization skills to deliver clear and actionable business insights.
hashtag