High Tech Performance Dashboard
تفاصيل العمل
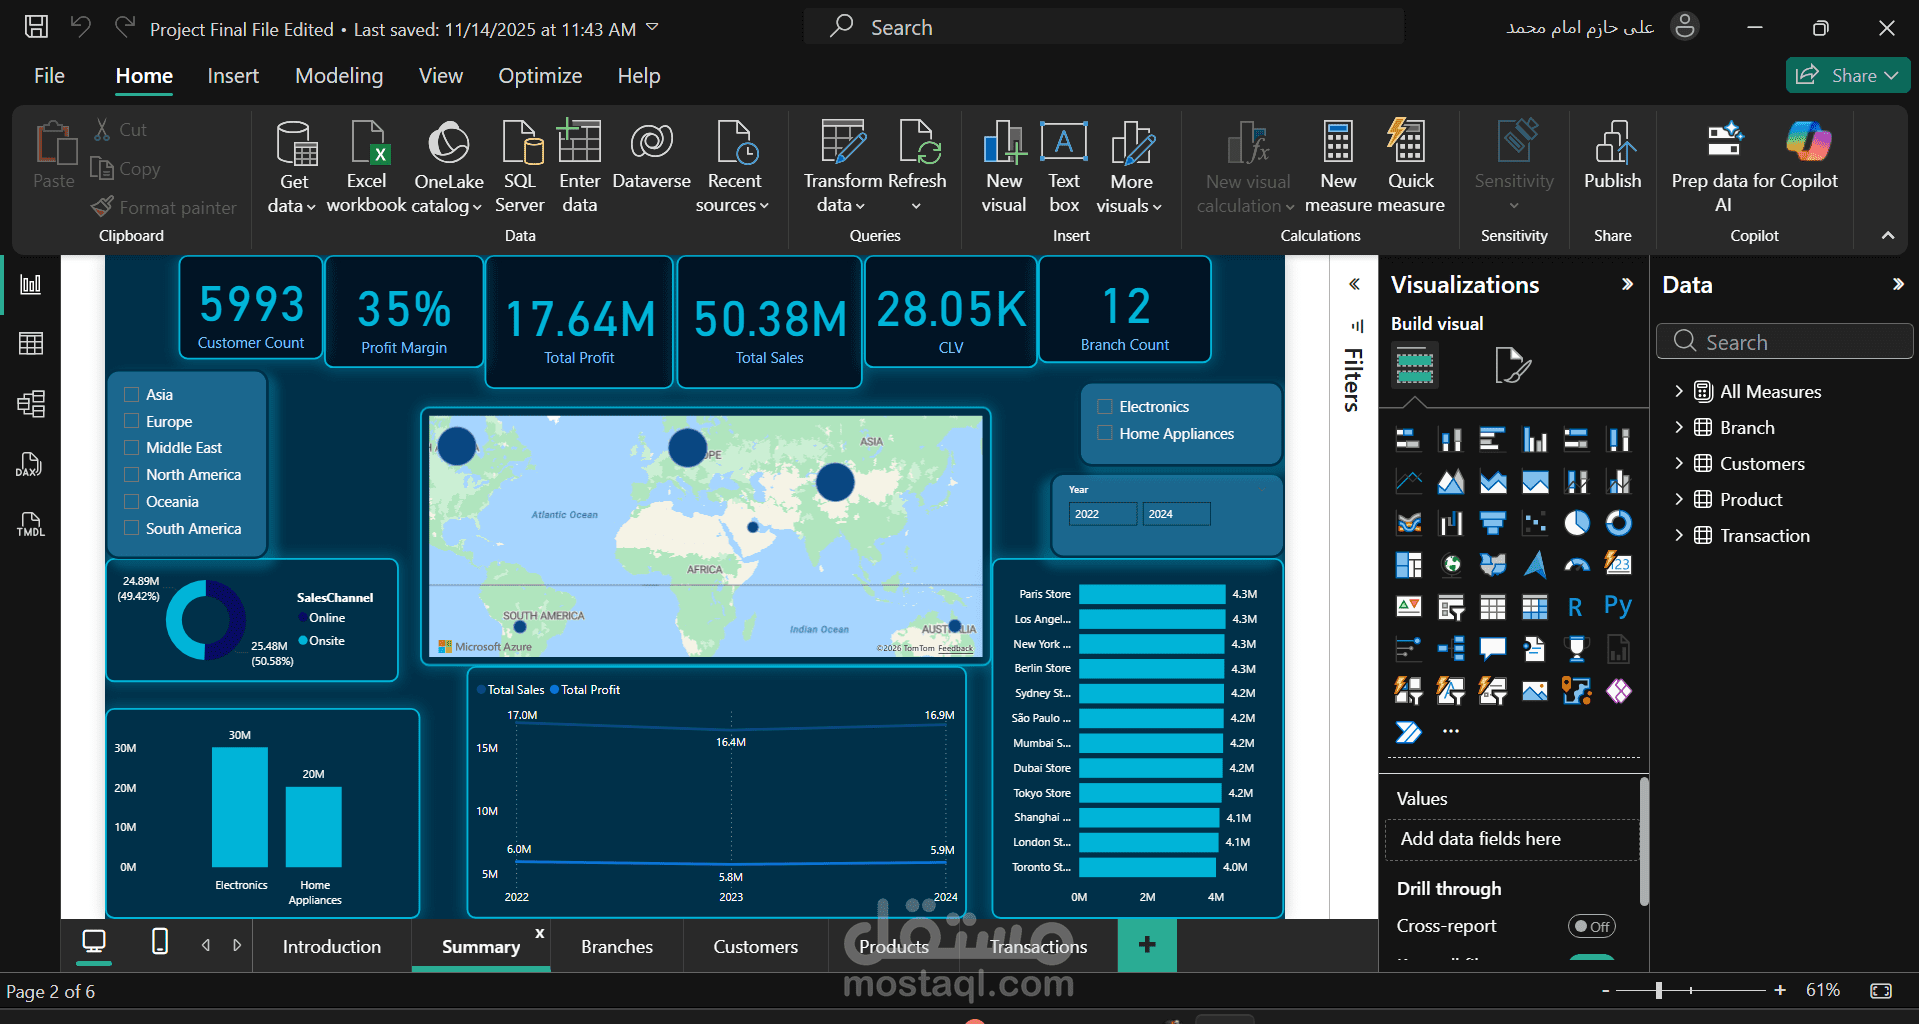
This project presents an interactive data visualization dashboard developed using Microsoft Power BI. The dashboard transforms raw data into clear and actionable insights through well-structured data modeling and effective visualizations.
It includes interactive charts, KPIs, and filters that allow users to analyze trends, compare metrics, and explore data dynamically. The project demonstrates my skills in data analysis, DAX calculations, and data visualization, highlighting my ability to turn complex datasets into meaningful business insights.