Dashboard
تفاصيل العمل
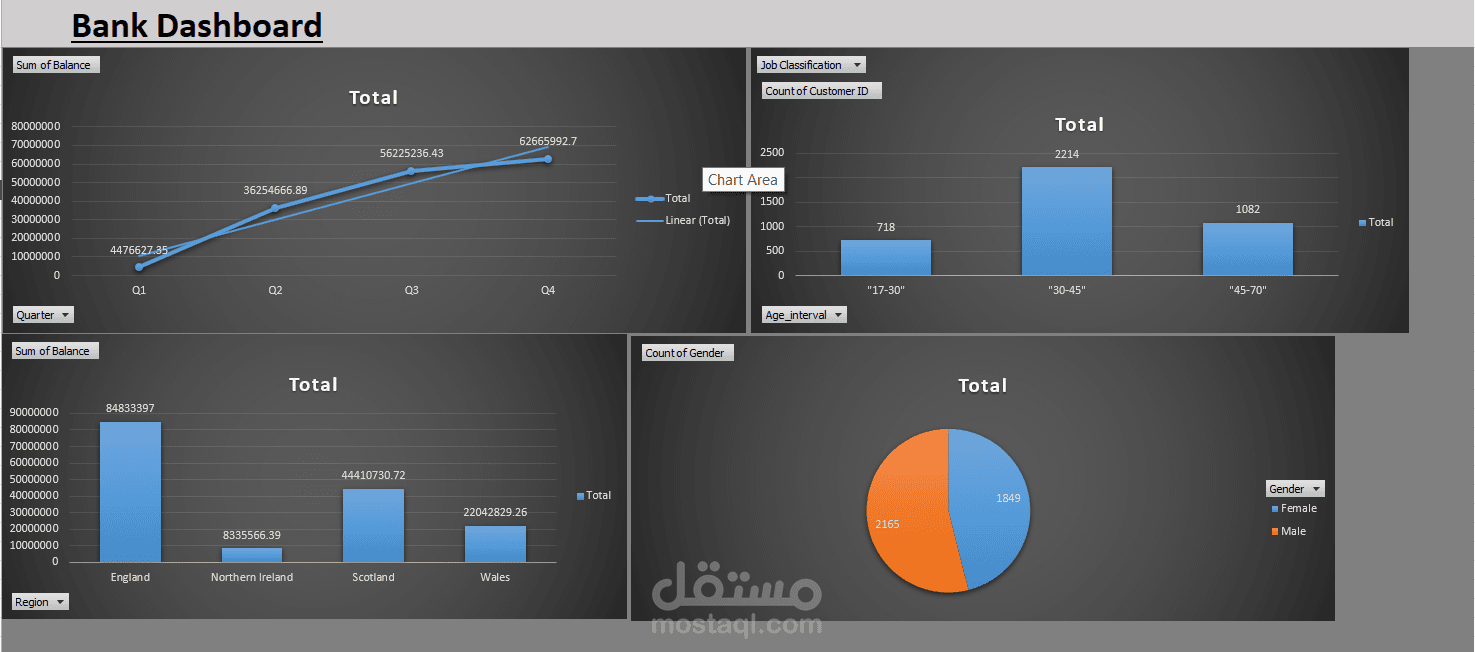
This image shows a Bank Dashboard, a business intelligence tool used to visualize and analyze financial data. The dashboard presents several key metrics, including the sum of balances over four quarters and a breakdown of customer numbers by age group and gender. It also provides a geographical analysis of balances, showing the total for different regions like England, Northern Ireland, Scotland, and Wales. The use of various chart types, such as line graphs, bar charts, and a pie chart, makes the data easy to interpret at a glance.