Titanic Dashboard using power bi
تفاصيل العمل
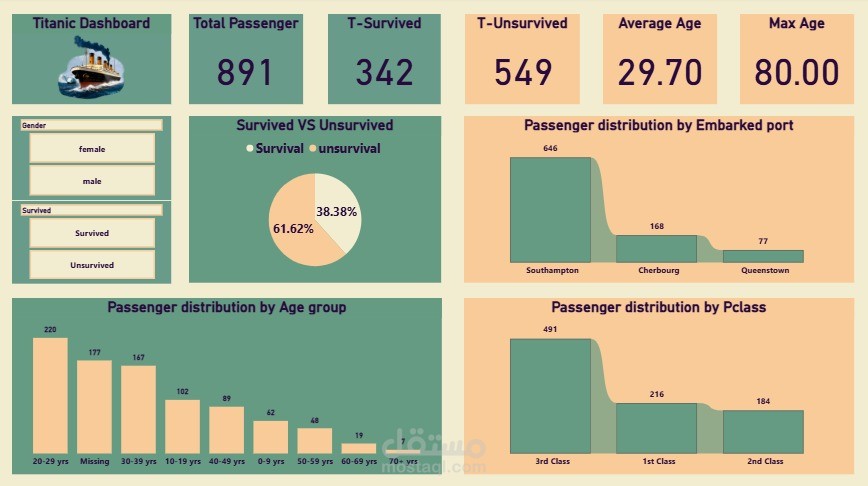
I recently built this interactive Titanic Dashboard to analyze one of the most famous datasets in data science. The dashboard highlights key insights about passenger demographics, survival rates, and distribution across classes, ports, and age groups.
Key Insights:
Total passengers analyzed: 891
Survival rate: 38.38%
Majority embarked from Southampton (646 passengers)
Most passengers were in 3rd Class (491)
Largest age group: 20–29 years (220 passengers)
This project showcases the power of data visualization in uncovering stories behind the numbers. Turning raw data into clear visuals helps us quickly identify patterns, trends, and critical insights.