Netflix data dashboard!
تفاصيل العمل
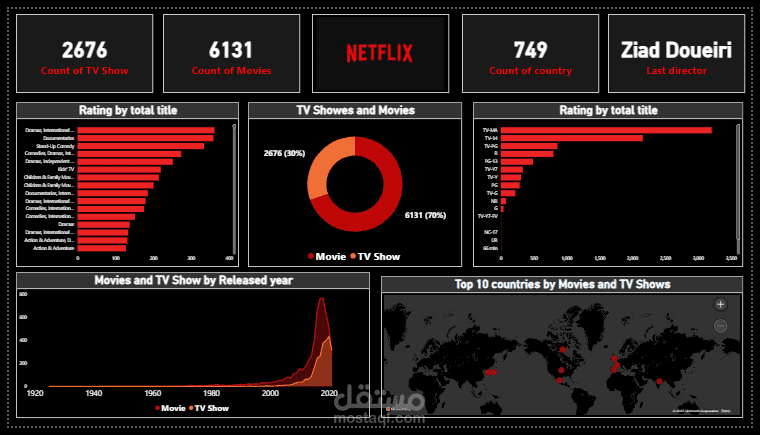
Netflix data dashboard! It's amazing to see the numbers behind one of the world's biggest streaming platforms.
From the massive number of movies and TV shows to the top countries consuming content, the insights are fascinating.
I was able to answer questions like:
Count of TV Shows vs. Movies:
Movies: 6,131 (70%)
TV Shows: 2,676 (30%)
Global Reach:
Content from 749 countries featured on the platform
Top countries with the largest number of titles clearly visible on the world map
Ratings Insights:
Highest number of titles fall under TV-MA and TV-14 ratings
Genres and certifications vary significantly across regions
Historical Growth:
A massive spike in content production post-2015 — Netflix’s golden expansion era!
Why it matters?
This dashboard helps content strategists, marketers, and media analysts quickly understand global content distribution, audience targeting, and Netflix’s growth trajectory.
Tools Used: Power BI | Data Visualization | Storytelling with Data