data visualization with python
تفاصيل العمل

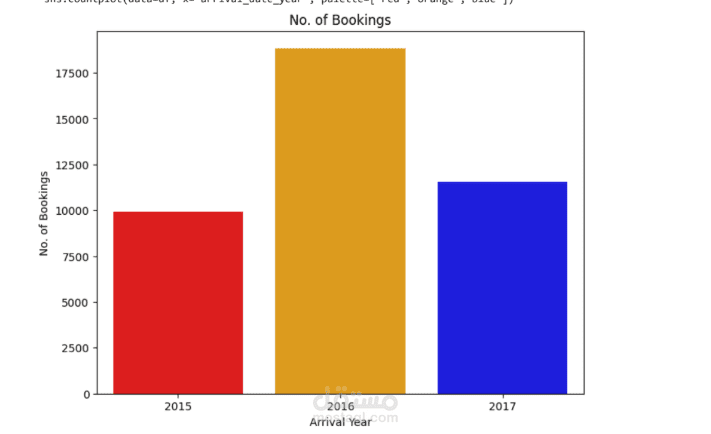
From the chart, we can see that the year 2016 recorded a higher number of bookings compared to other years. It is recommended that
hotel management analyze the factors that contributed to this success and repeat or enhance them in the coming years to maximize
profit.
code:plt.figure(figsize=(8, 6))
sns.countplot(data=df, x='arrival_date_year', palette=['red','orange','blue'])
plt.title('No. of Bookings')
plt.xlabel('Arrival Year')
plt.ylabel('No. of Bookings')
plt.show()