Clothes Shop Analysis
تفاصيل العمل
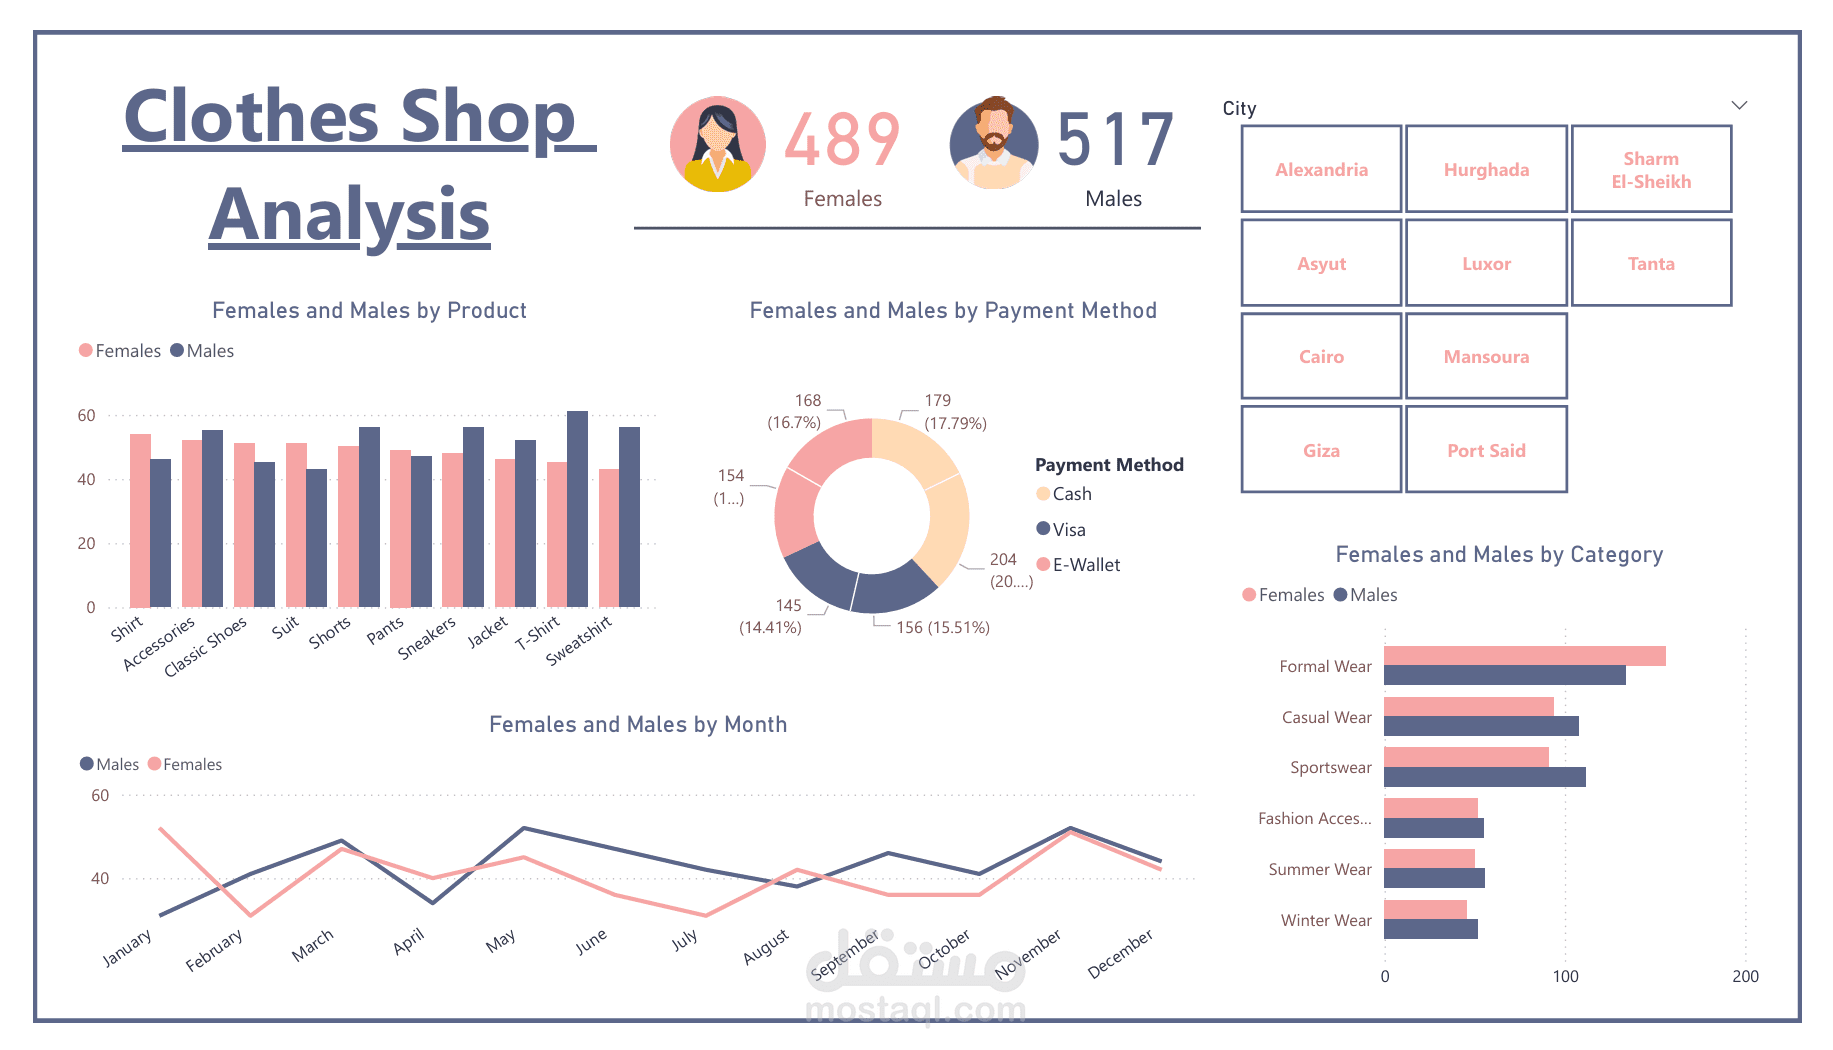
Clothes Shop Analysis Dashboard – Power BI
I designed and developed a Power BI dashboard to analyze customer behavior in a clothes shop. The project focused on providing clear, actionable insights by comparing male and female customers across different dimensions.
Key Features:
Products Analysis: Breakdown of purchases (shirts, suits, shoes, accessories, etc.) by gender.
Payment Methods: Visualization of customer preferences (cash, visa, e-wallet).
Time Trends: Monthly shopping patterns to identify peak periods for sales.
Regional Insights: Sales distribution across different Egyptian cities.
Category Analysis: Comparison of male and female purchases in formal wear, casual wear, sportswear, and more.
Tools & Skills Used:
Power BI (data modeling, DAX, visualization design)
Data cleaning and transformation
Storytelling with data for decision-making
This dashboard demonstrates the ability to turn raw sales data into business insights that can guide marketing strategies, stock management, and customer targeting.