E-commerce data
تفاصيل العمل
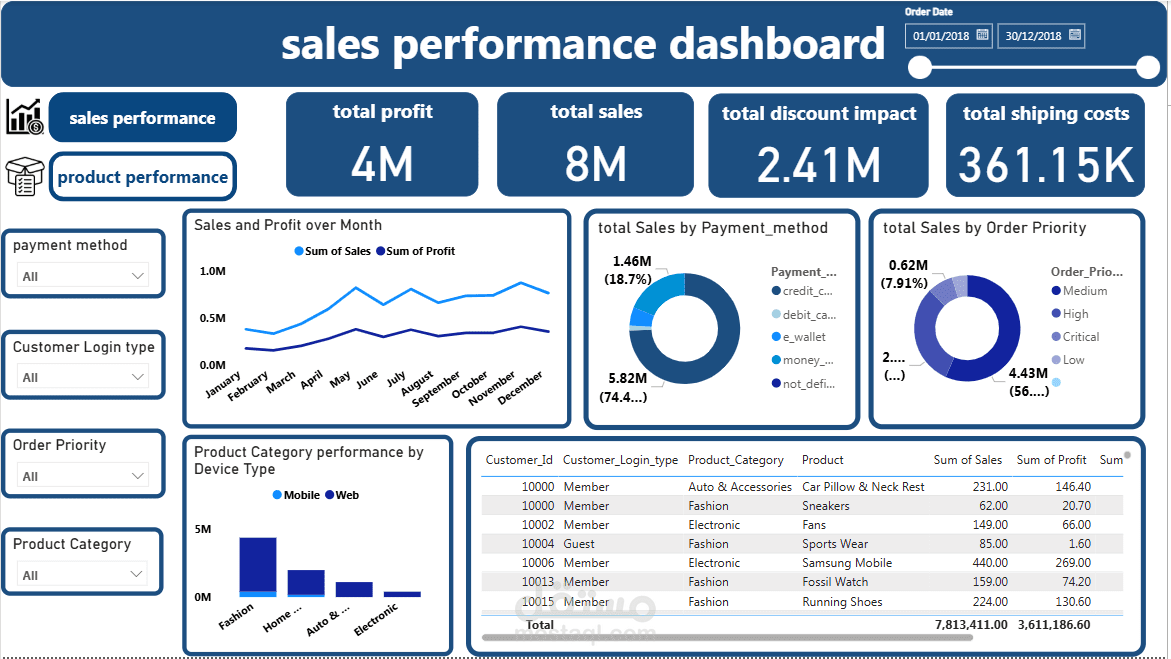

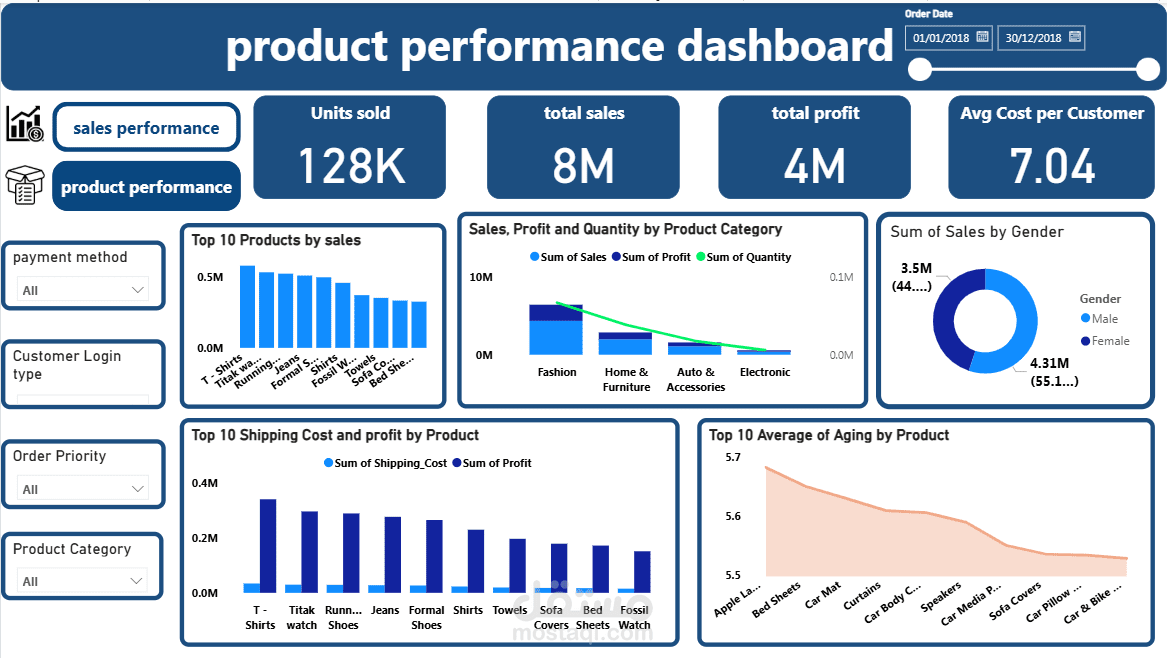
تقرير Power BI لقسمين مختلفين في بيانات التجارة الإلكترونية
يتضمن لوحتين تفاعليتين: أداء المبيعات و أداء المنتجات
المؤشرات الرئيسية (KPI):
-إجمالي المبيعات
-إجمالي الربح
-عدد الوحدات المباعة
-تكلفة الشحن
الرسوم البيانية:
-خطي (Line Chart)
-دونات (Donut Chart)
-شريطي (Bar Chart)
-عمودي (Column Chart)
-أدوات التصفية (Slicers):
التاريخ المنتج وغيرها…
-الرسوم البيانية المحددة:
-أعلى 10 منتجات من حيث تكلفة الشحن والربح
-أعلى 10 منتجات من حيث متوسط العمر (Aging)
الرؤى (Insights):
-مبيعات أجهزة الموبايل منخفضة جدًا
-أعلى شهر من حيث المبيعات والربح هو نوفمبر وأدنى شهر هو فبراير
-أكثر وسيلة دفع شائعة هي بطاقة الائتمان
-أولوية الطلب عادةً متوسطة
-الفئة الأكثر أداءً هي الأزياء والأقل أداءً هي الإلكترونيات
-أعلى تكاليف شحن هي للمنتج T-shirt ولكنه يحقق أعلى المبيعات
-متوسط عمر منتجات Apple Laptops مرتفع
التوصيات (Recommendations):
-إطلاق برنامج تجديد حصري للهواتف المحمولة (Mobile-Exclusive Revamp Program)
-استغلال زخم نوفمبر وخلق شعور بالعجلة في فبراير
-تشجيع استخدام بطاقات الائتمان بشكل أكبر مع التحضير لطرق دفع أخرى
-تحسين الشحن وإدارة المخزون لكفاءة الطلبات ذات الأولوية المتوسطة
-التركيز على فئة الأزياء وإعادة تقييم استراتيجية الإلكترونيات
-تشجيع الطلبات الكبيرة وتقليل تكاليف الشحن وزيادة قيمة منتج T-shirt
-إطلاق حملة تصفية المخزون العدوانية لمنتجات Apple Laptops