Netflix Report using Power BI
تفاصيل العمل
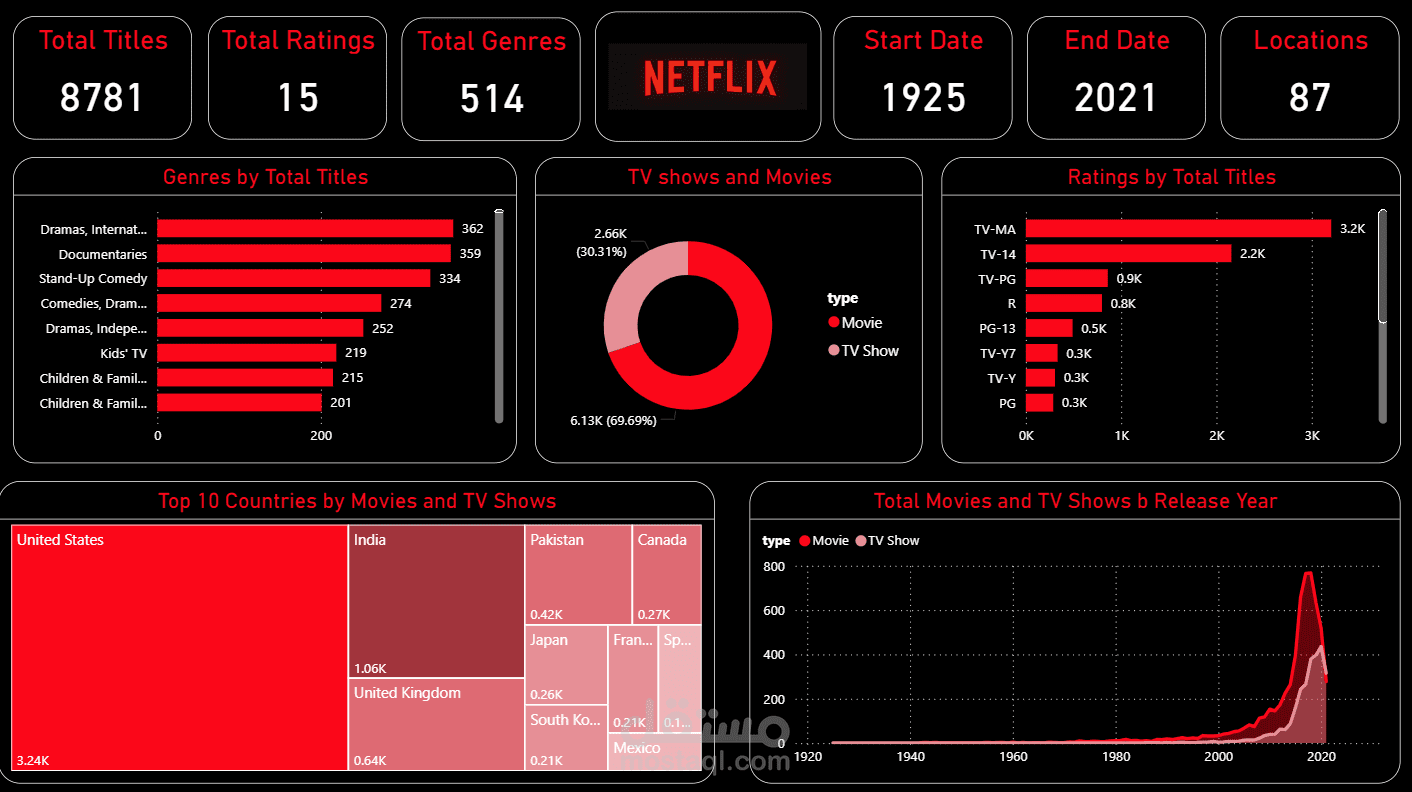
تقدّم هذه اللوحة نظرة شاملة على بيانات محتوى Netflix، من خلال مجموعة من الرسوم التفاعلية والمؤشرات الإحصائية.
تعرض اللوحة أهم الأرقام الرئيسية، مثل:
إجمالي عدد العناوين: 8781 عنواناً
إجمالي التصنيفات: 15 تصنيفاً
عدد الأنواع (Genres): 514 نوعاً
تاريخ البداية: 1925
تاريخ النهاية: 2021
عدد المواقع الجغرافية: 87 موقعاً
الأنواع حسب إجمالي العناوين
يُعرض في هذا القسم مخطط أعمدة أفقي يوضح توزيع العناوين على الأنواع المختلفة، حيث تتصدر فئة الدراما والأعمال الدولية بعدد 362 عنواناً، تليها الأفلام الوثائقية بـ 359، ثم عروض الكوميديا الارتجالية (Stand-Up Comedy) بـ 334 عنواناً.
البرامج التلفزيونية مقابل الأفلام
يُعرض في هذا القسم مخطط دونات (Doughnut Chart) يُظهر أن 6.13 ألف عنوان (96.99%) هي برامج تلفزيونية، بينما 2.66 ألف (30.31%) هي أفلام.
التصنيفات حسب إجمالي العناوين
يُظهر هذا القسم مخطط أعمدة يوضح أن تصنيف TV-MA يحتل المرتبة الأولى بـ 3.2 ألف عنوان، يليه TV-14 بـ 2.2 ألف، ثم TV-PG بـ 0.9 ألف عنوان.
أعلى 10 دول من حيث عدد الأفلام والبرامج
يُعرض في هذا القسم مخطط Treemap يُظهر أن الولايات المتحدة تتصدر القائمة بـ 3.24 ألف عنوان، تليها الهند بـ 1.06 ألف، ثم باكستان بـ 0.42 ألف.
إجمالي الأفلام والبرامج حسب سنة الإصدار
يتضمن هذا القسم مخطط خطي (Line Chart) يوضّح الزيادة الملحوظة في عدد المحتويات منذ عشرينيات القرن الماضي حتى بلغت ذروتها حوالي عام 2020.