Stock Span Visualizer
تفاصيل العمل
The project is a desktop application for financial analysis, built using Python, PyQt5, and Matplotlib. It allows users to calculate and visualize stock spans using an efficient stack-based algorithm for technical analysis and trend identification.
Type of Work
Desktop Application Development: The project involves creating a GUI-based application with interactive visualizations and real-time data processing.
Algorithm Implementation: Includes developing an efficient O(n) stack-based algorithm for stock span calculation.
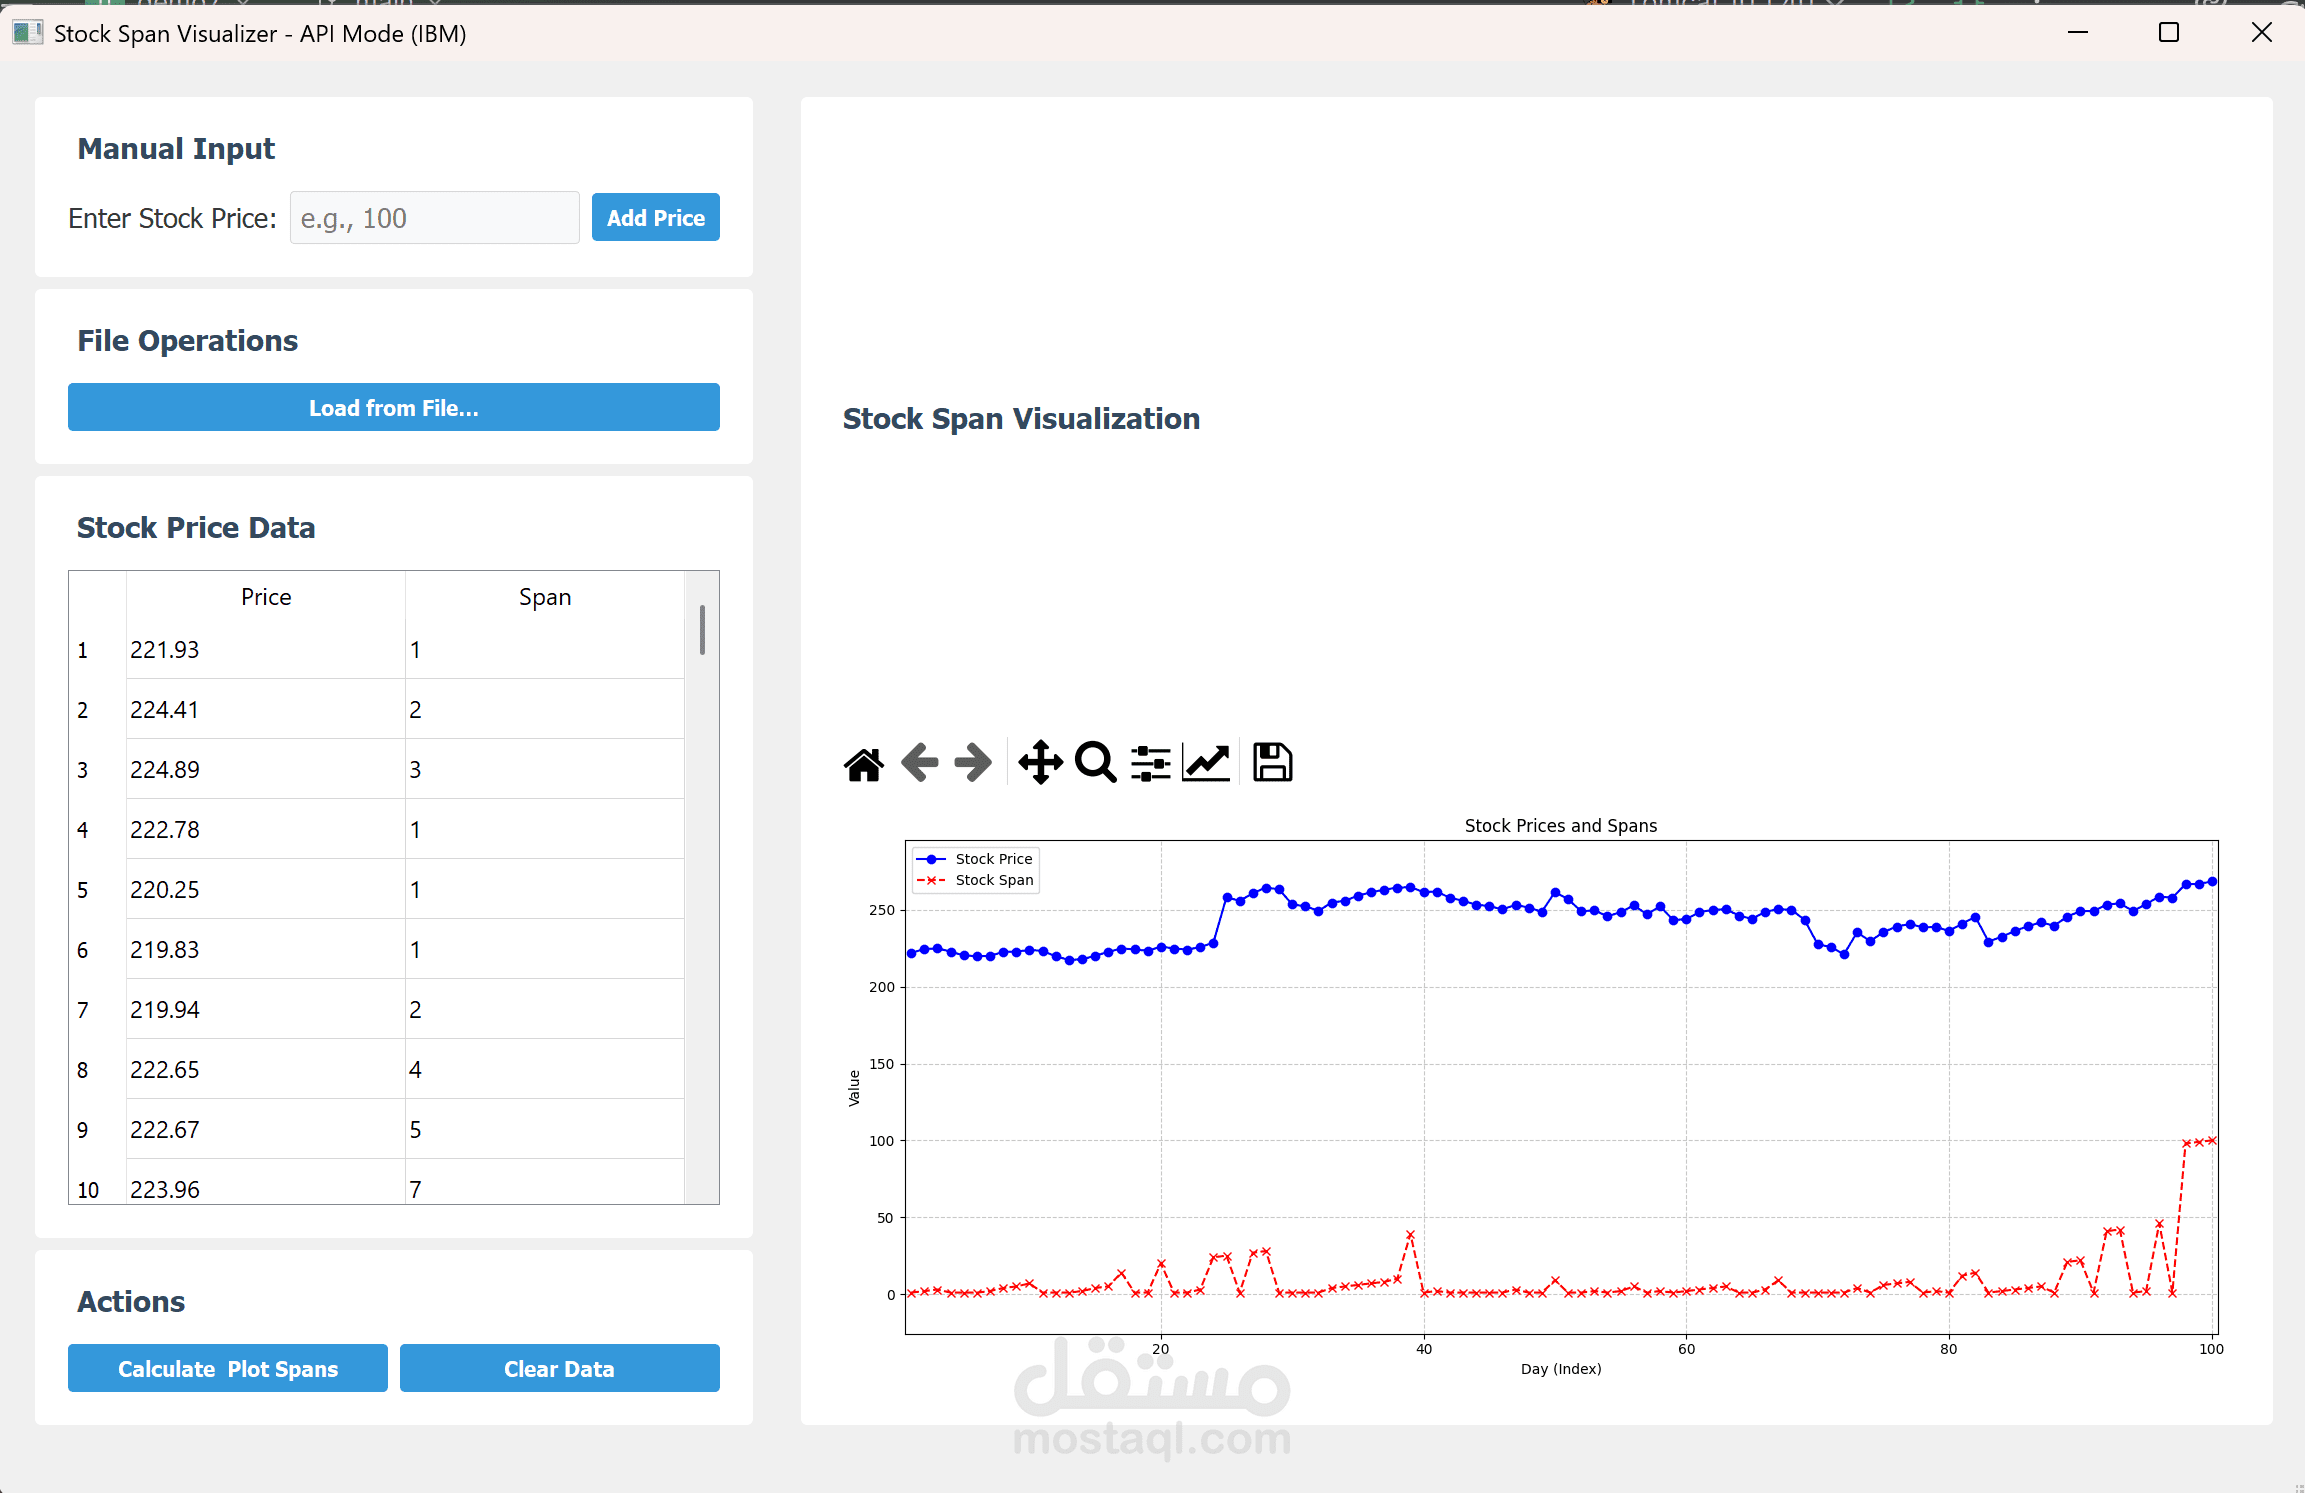
Data Visualization: Designing interactive charts and graphs using Matplotlib for financial data analysis.
API Integration: Implementing real-time stock data fetching from Alpha Vantage API
.
Features
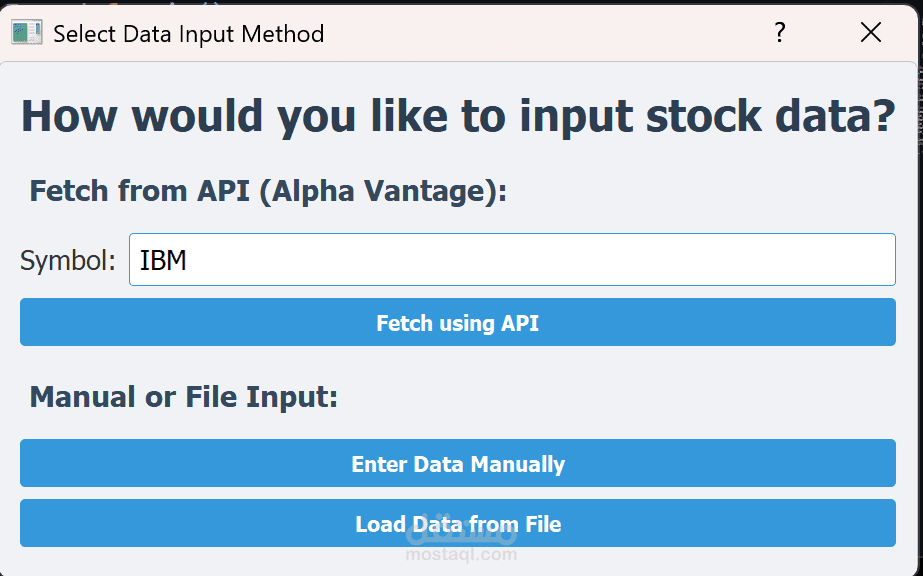
Multiple Data Input Methods: Manual entry, file import, and real-time API data fetching.
Interactive Visualizations: Line charts, bar charts, and combined visualizations with navigation toolbar.
Efficient Algorithm: Stack-based implementation that reduces time complexity from O(n²) to O(n).
Professional UI: Modern PyQt5 interface with responsive layout and data table display.
Error Handling: Comprehensive validation and user feedback for all operations
.
Way It Is Carried Out
Frontend: PyQt5 files (main_window.py, input_selection.py) handle user interface, input forms, and display components.
Backend: Python classes (stock_logic.py, api_client.py) process stock data, implement the stack algorithm, and handle API communications.
Data Processing: Custom Stack class calculates spans efficiently, while Matplotlib generates interactive visualizations.
Configuration: API credentials stored in api_client.py, with support for multiple data sources and formats.
Deployment: The ap