Distributions of several clinical features in Diabetic patients
تفاصيل العمل

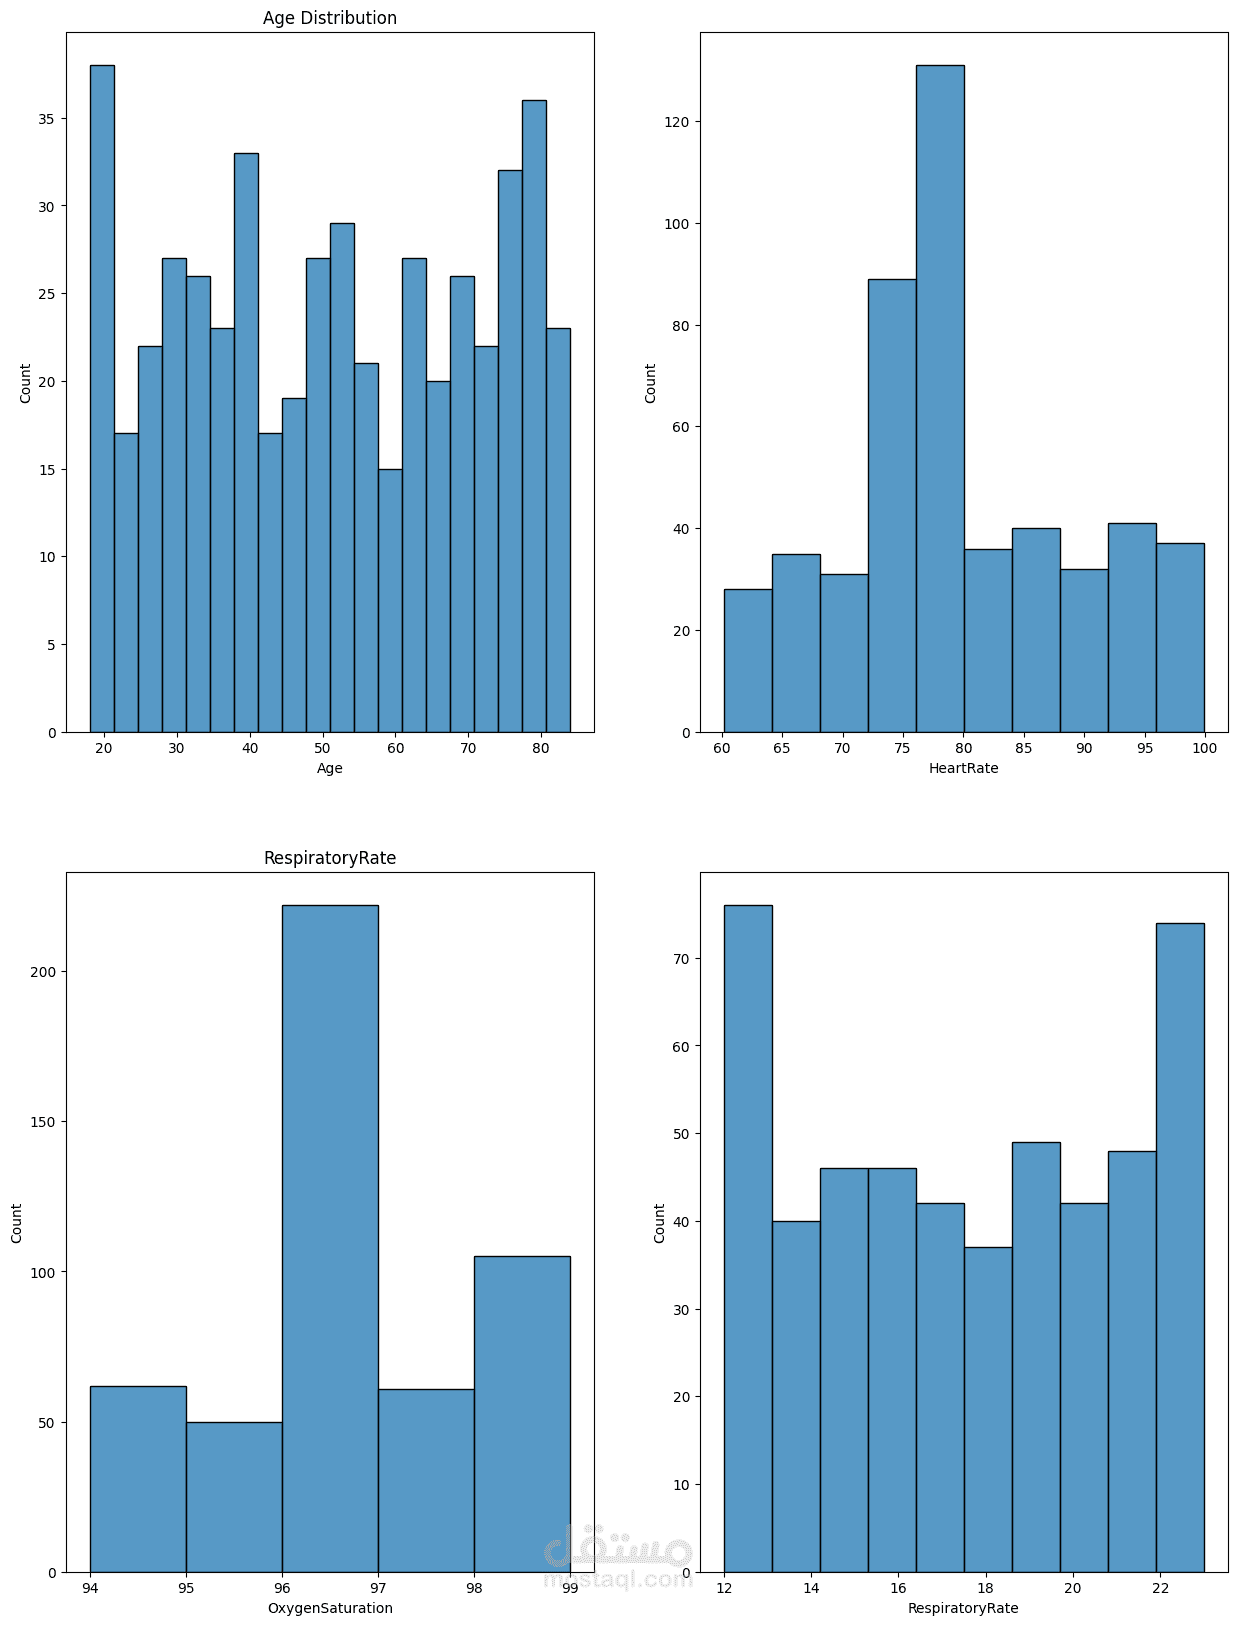
This plot represents distributions of several clinical features such as Age, Heart Rate, Respiratory Rate, and Oxygen Saturation.
As a pharmacy student, I'm exploring how data can improve healthcare decisions and patient outcomes. This project helped me understand not just code, but the stories hidden behind health data.
Tools used: Python (Matplotlib / Seaborn)
Goal: Build a solid foundation in data analytics