Revenue Performance Dashboard
تفاصيل العمل
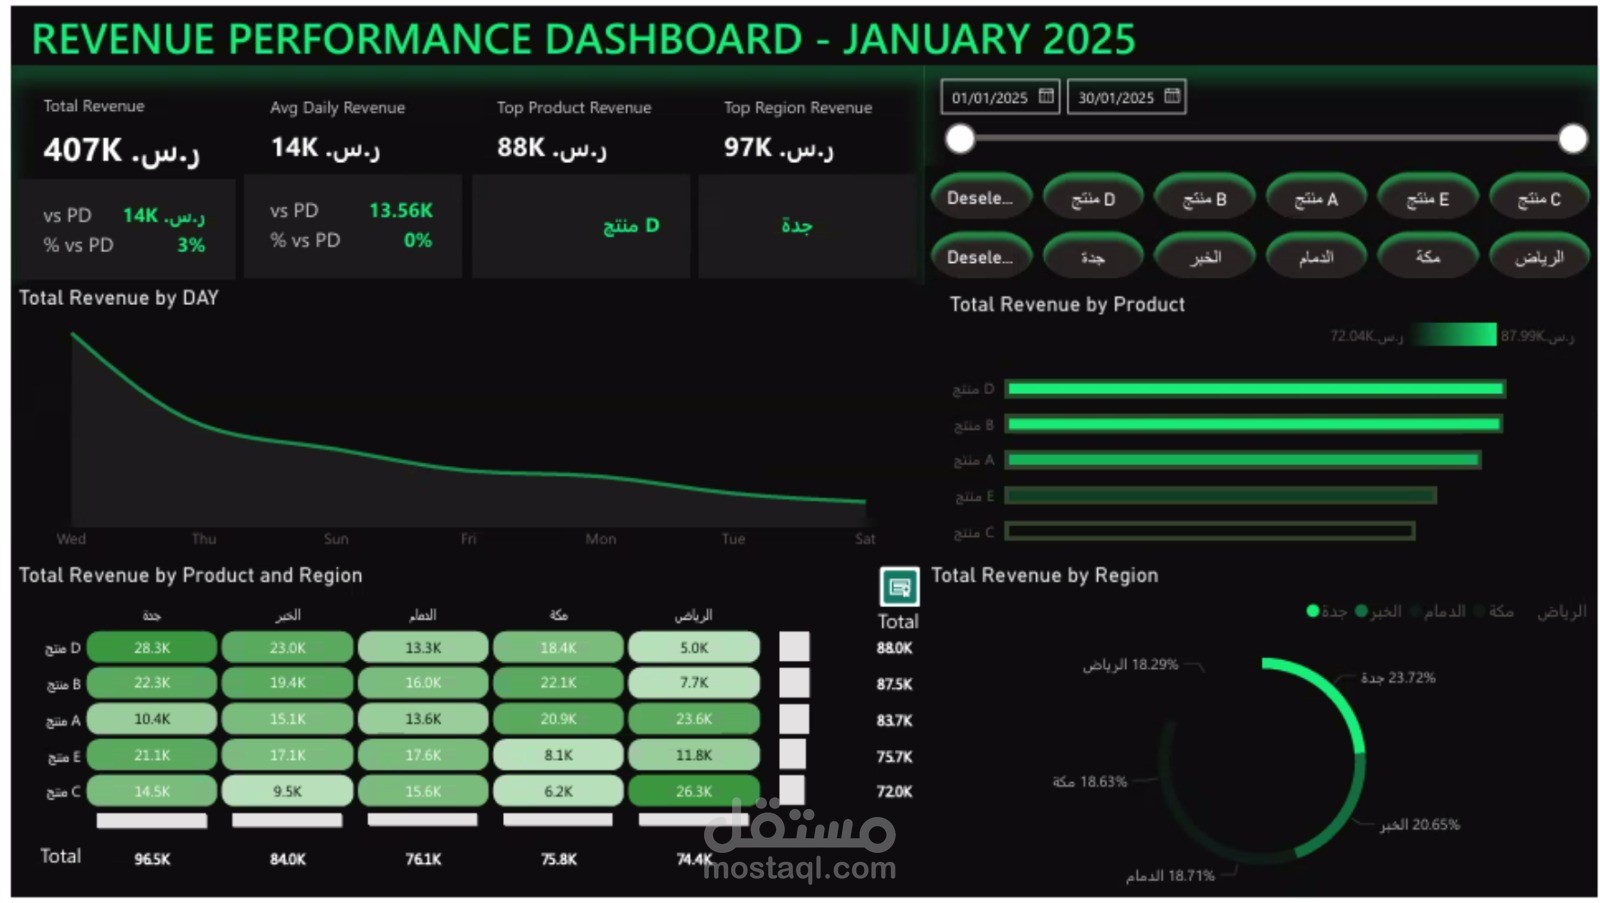
This dashboard provides a visual summary of revenue performance for January 2025. It highlights key metrics such as total revenue (407K), average daily revenue, top-performing products, and leading regions. The layout includes line charts showing daily revenue trends, bar charts comparing product revenues, and a circular chart illustrating regional revenue distribution. A matrix table breaks down revenue by product and region, offering granular insights. The dashboard is designed for quick analysis, enabling stakeholders to monitor performance, identify growth areas, and make data-driven decisions.