Exploratory Data Analysis (EDA) with SQL
تفاصيل العمل
Project Overview
This project showcases the use of SQL to perform Exploratory Data Analysis (EDA) on a sales dataset.
The aim is to clean, explore, and analyze data to uncover patterns, trends, and business insights that support better decision-making.
️ Tools & Technologies
SQL (T-SQL)
Relational Database (SQL Server)
Dataset: Customers, Products, Sales
Key Steps in Analysis
Database Exploration → Listing tables, schemas, and columns.
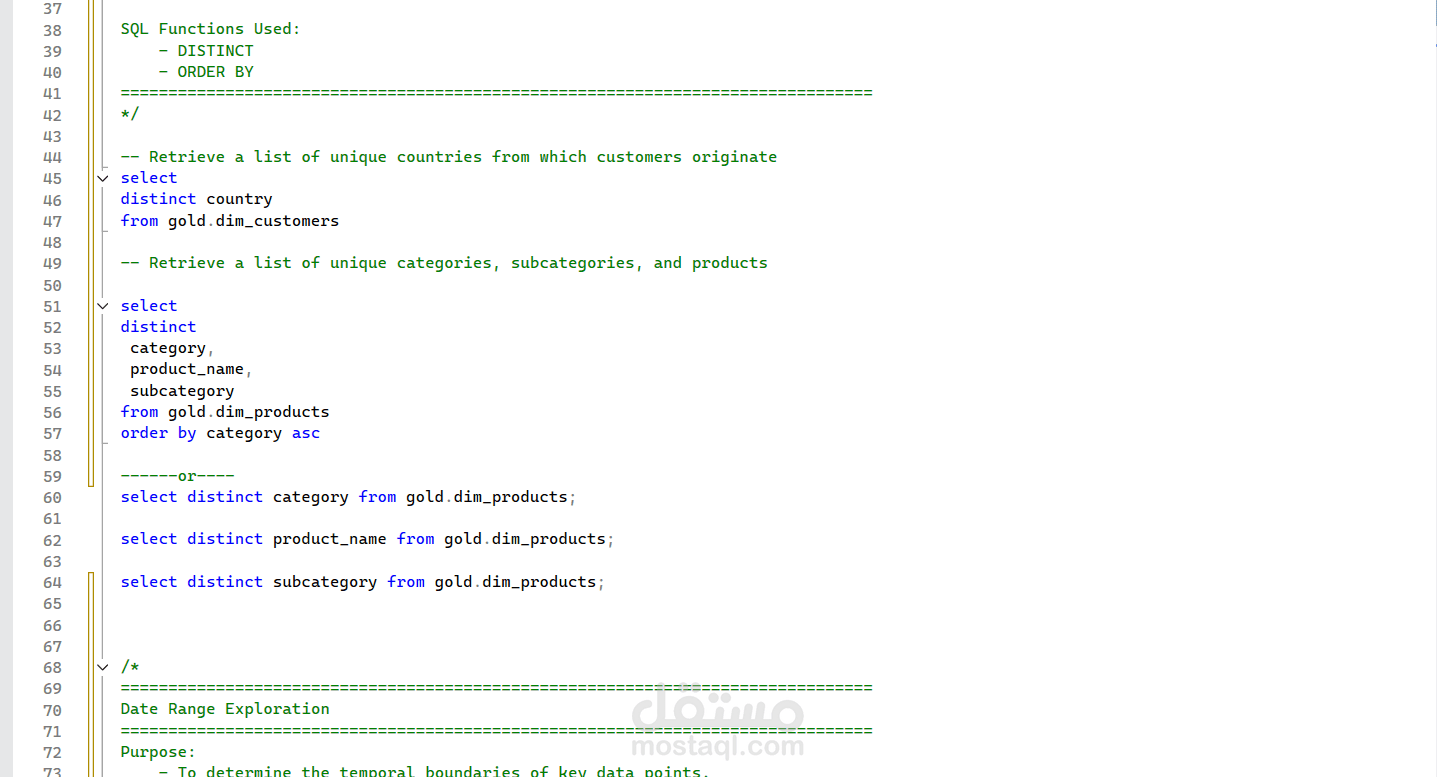
Dimensions Exploration → Extracting unique categories, products, and customer demographics.
Date Range Exploration → Finding first/last orders, total sales duration, and customer ages.
Measures & Metrics → Total sales, quantity, orders, average price, number of products and customers.
Magnitude Analysis → Revenue by category, customers by country/gender, revenue per customer.
Ranking Analysis → Top/Bottom products, top customers, least active customers.
Insights & Results
Identified top-performing products and low-performing products.
Highlighted top 10 customers driving revenue.
Revealed sales trends by category and country.
Discovered average costs per category and customer distribution.