Sales Dashboard
تفاصيل العمل
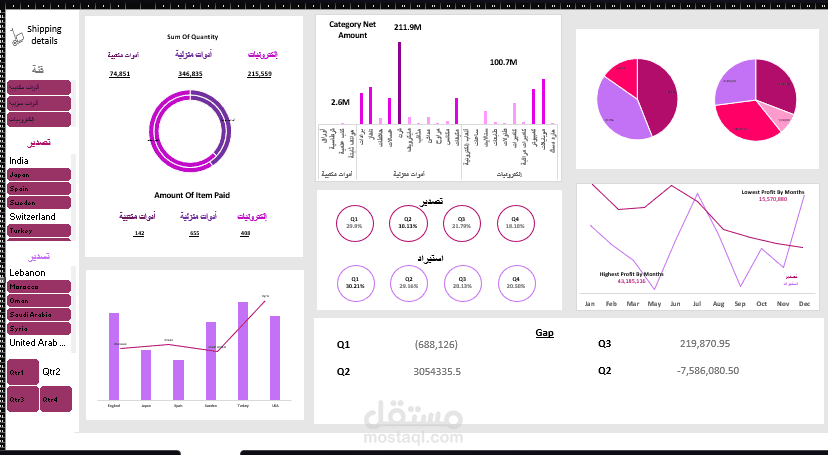
Sales Dashboard Overview
This interactive Sales dashboard provides a clear, comprehensive view of business performance, product sales, and profitability. It highlights key metrics such as total sales, quantity sold, and a detailed breakdown by product categories, including Electronics and Office Supplies.
The dashboard also visualizes:
Geographic Performance across various countries like England, Japan, and the USA.
Detailed Category Contribution with a breakdown of net amounts for electronics ($211.9M) and office supplies ($100.7M).
Monthly Profitability Trends for quick performance tracking, showing both the highest and lowest profit months.
Quarterly Sales and Profit/Loss figures to easily identify seasonal trends and financial health.
Detailed Quantity Sold metrics for a clear view of product volume.
This dashboard makes complex sales data easy to read and understand, empowering you to identify trends, optimize strategies, and make smarter, data-driven decisions.