Pharma Dashboard
تفاصيل العمل
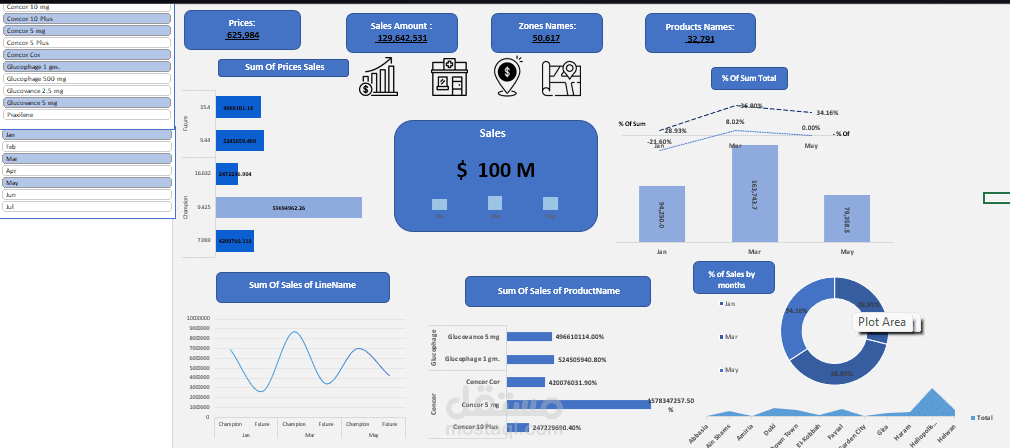
Pharma Performance Dashboard
This Pharma dashboard provides a comprehensive view of business performance with real-time insights into product, zone, and monthly sales. It highlights a total sales amount of $129.6M across 32,791 products and 50,617 zones.
Key features include:
Total sales of $100M with breakdowns by product line and category
Monthly sales trends (January–May) with percentage contribution to overall sales
Zone-level sales distribution for deeper market analysis
Product performance comparison through interactive charts
Percentage of sales by months displayed in a clear donut chart
With its intuitive visualizations and interactive filters, this dashboard makes it easy to track performance, identify top-selling products, and monitor sales growth across regions.