Needs Dashboard
تفاصيل العمل
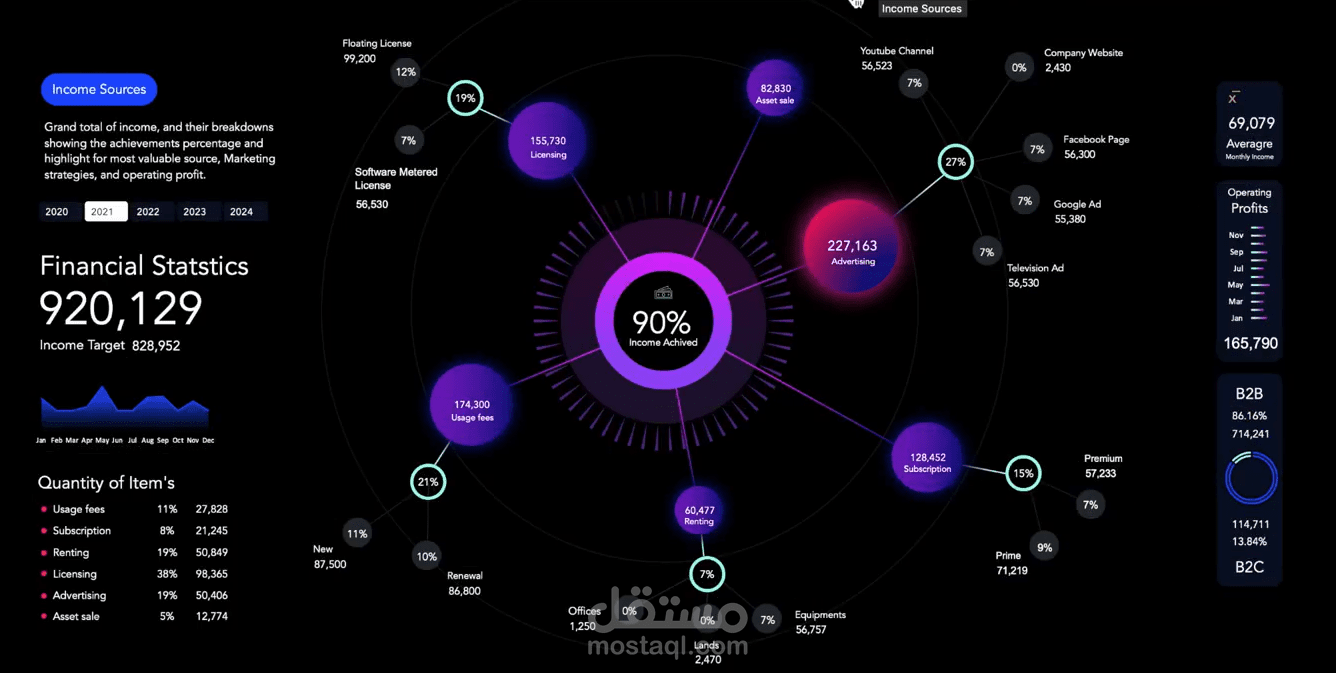
Needs Dashboard Overview
This interactive Needs dashboard showcases a clear view of income performance, targets, and achievements. It highlights total income of 920,129 (90% of the target achieved) with a detailed breakdown by advertising, licensing, subscriptions, usage fees, renting, and asset sales.
The dashboard also visualizes:
Monthly income trends for quick performance tracking
Detailed advertising source contributions (Facebook, Google, YouTube, etc.)
B2B vs. B2C income distribution (86% vs. 14%)
Operating profits across all months
this dashboard makes complex financial data easy to read and understand, supporting smarter business decisions.