company sales data csv
تفاصيل العمل

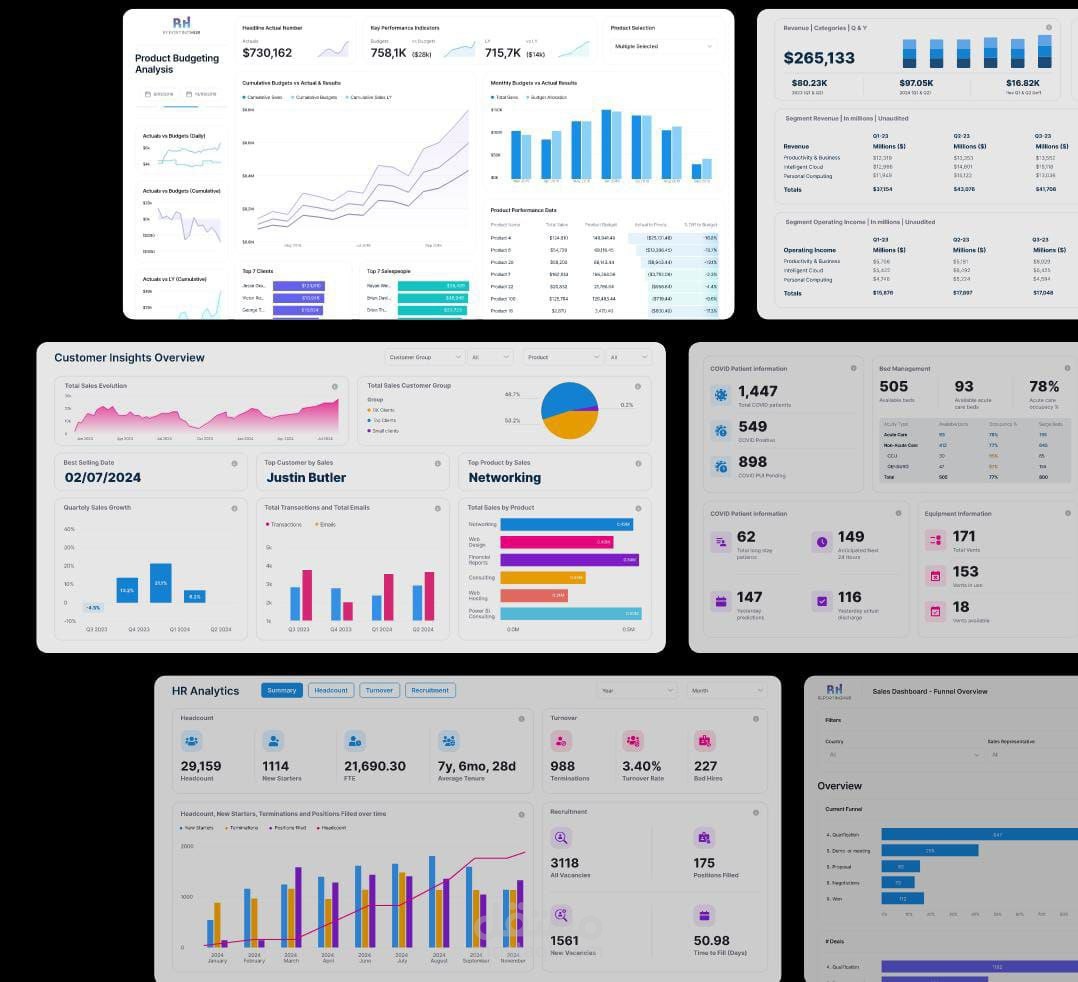
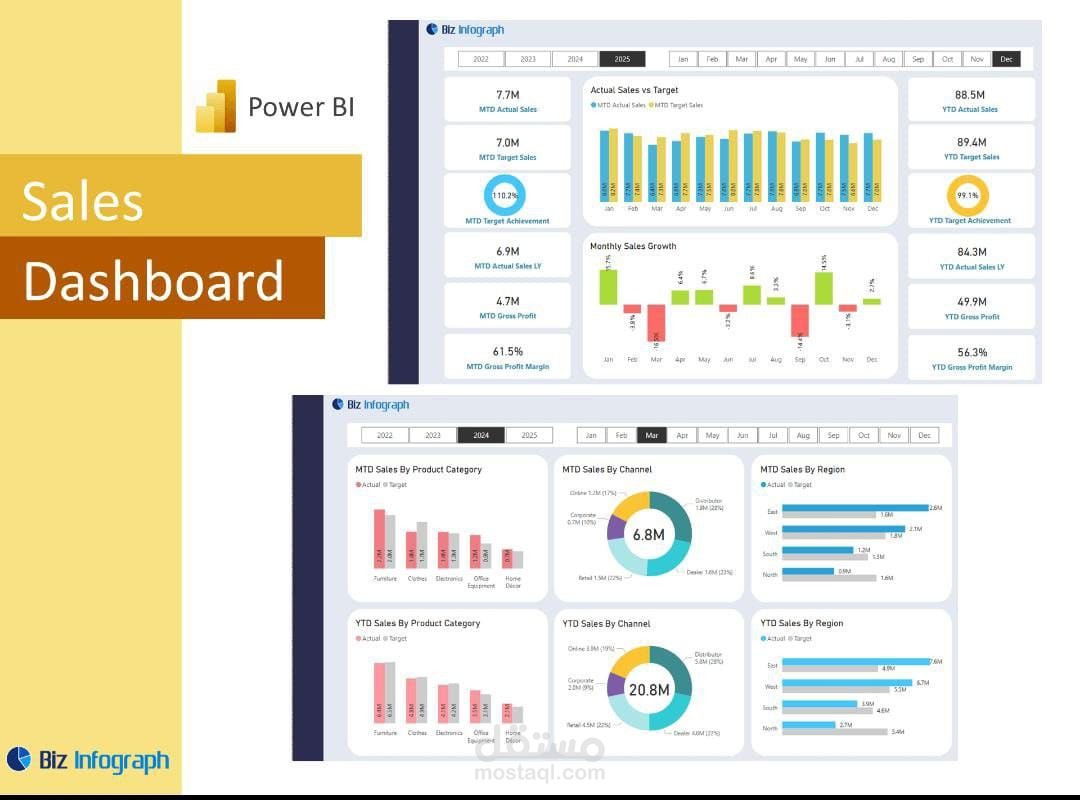
Dashboard Description: This Power BI dashboard features:
· Top KPIs: Total Sales, Total Orders, Average Order Value, Top Product
· Middle: Monthly sales trend line chart
· Left: Top 5 best-selling products bar chart
· Right: Sales by region pie chart
· Bottom: Detailed table with filters for category, region, and date
December recorded the highest sales.
· Phone is the overall top-selling product.
· Cairo is the highest contributing region.
· The average order value remains stable year-round.
· These insights support data-driven sales strategy decisions
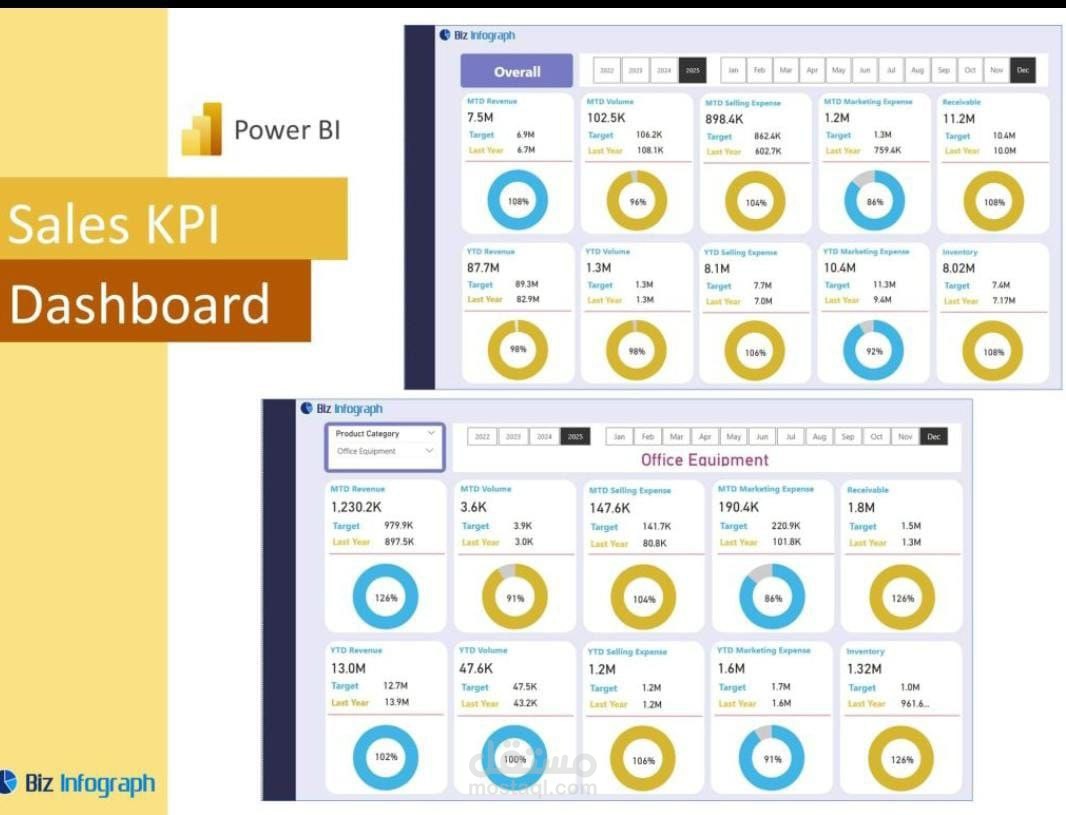
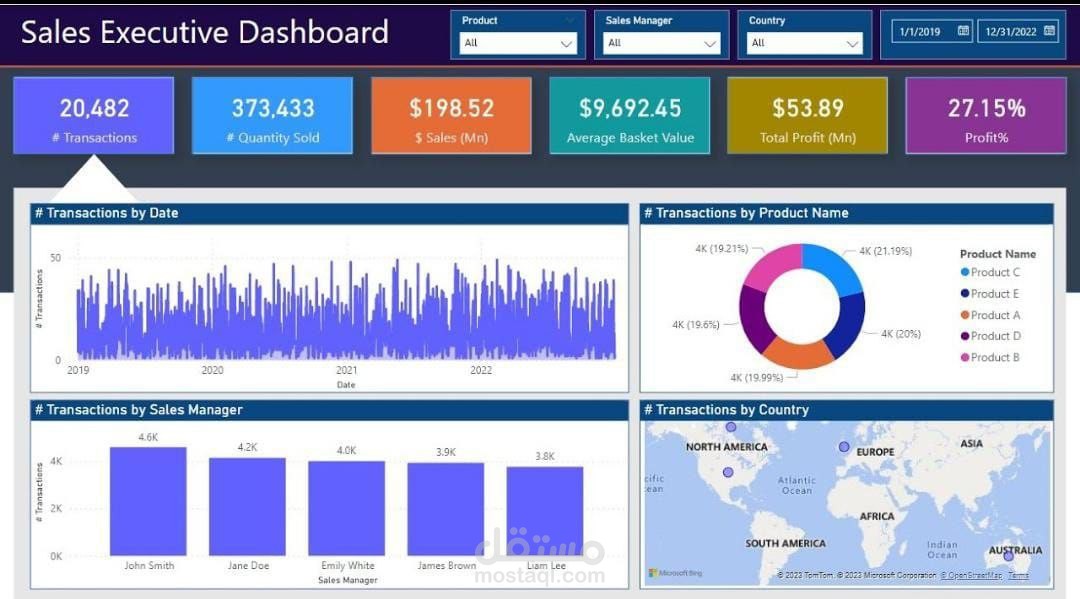
Dashboard Description: This Power BI dashboard features:
· Top KPIs: Total Sales, Total Orders, Average Order Value, Top Product
· Middle: Monthly sales trend line chart
· Left: Top 5 best-selling products bar chart
· Right: Sales by region pie chart
· Bottom: Detailed table with filters for category, region, and date