Sales Performance
تفاصيل العمل
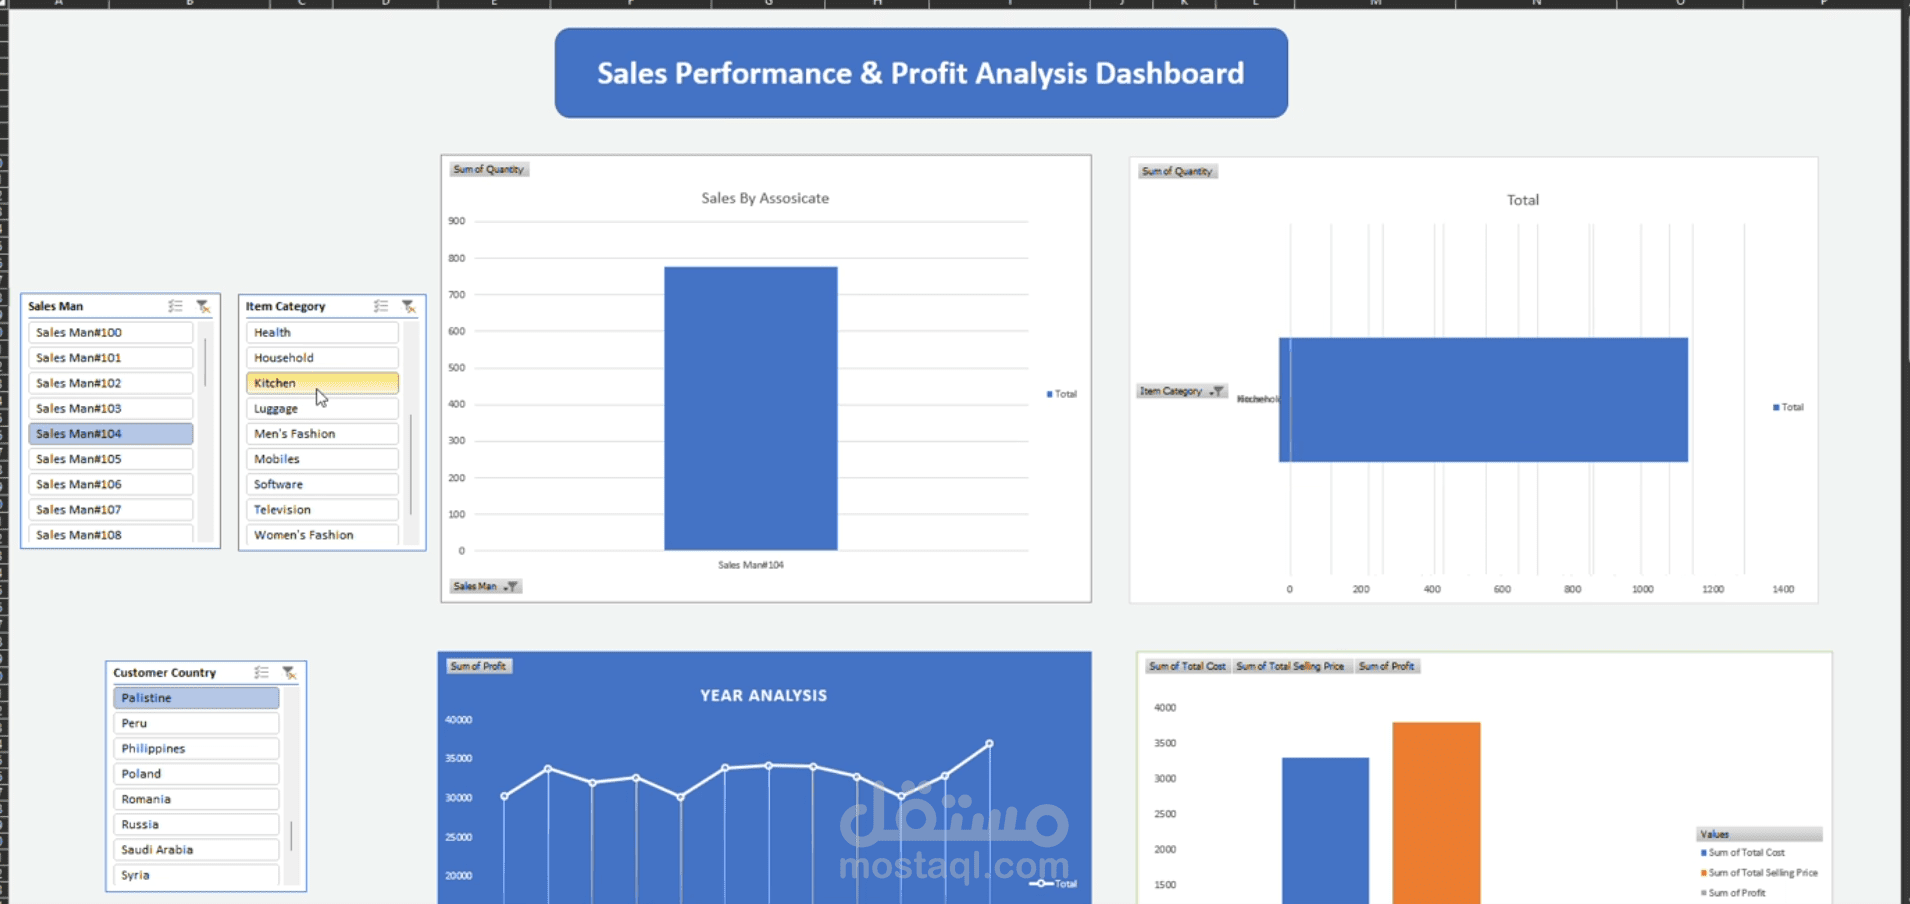
This Excel report visualizes:
Sales by representatives
Profit distribution by product category and country
Monthly trends in total profit
Fully interactive filtering by sales rep, year, item type, and region
Functions & Tools I Practiced:
Pivot Tables & Pivot Charts
Slicers for interactive filtering
Conditional Formatting for visual highlights
Custom Chart Design using color themes and rounded headers
Shapes for UI/UX dashboard styling
Excel Functions Used:
SUM, TEXT, ROUND, YEAR, MONTH
IF – for conditional logic
Nested IF – handling multi-condition decision logic
IF + OR + AND – complex multi-condition filters
IFS – for cleaner multiple condition testing
COUNT, COUNTIF, COUNTIFS – for frequency analysis
VLOOKUP, IFERROR – for robust lookups and error handling
Skills Gained:
Data structuring & cleaning
Building dynamic Excel dashboards
Applying logical & statistical functions
Data storytelling & insights communication