Sales Store Data Dashboard
تفاصيل العمل
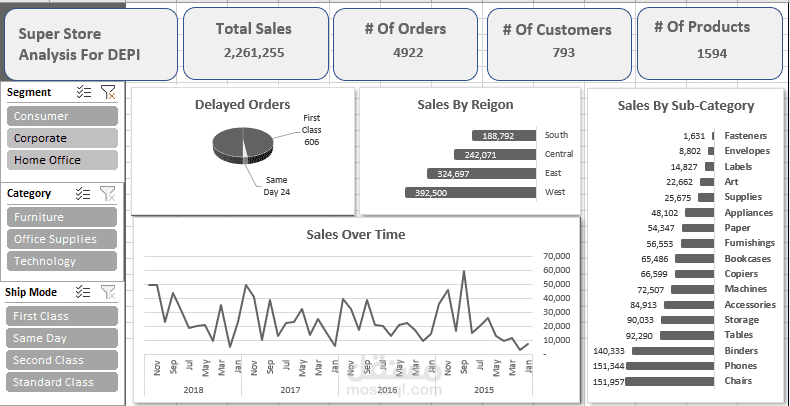

Built an interactive dashboard in Excel for monthly sales trends and top products. Designed to provide key insights into sales performance, identify popular products, and track revenue over time.
Impact: This project showcased my ability to create clear, interactive visual stories from raw sales data using Excel, enabling stakeholders to quickly grasp performance metrics and support data-driven decision-making