Dashboard for Sales performance
تفاصيل العمل
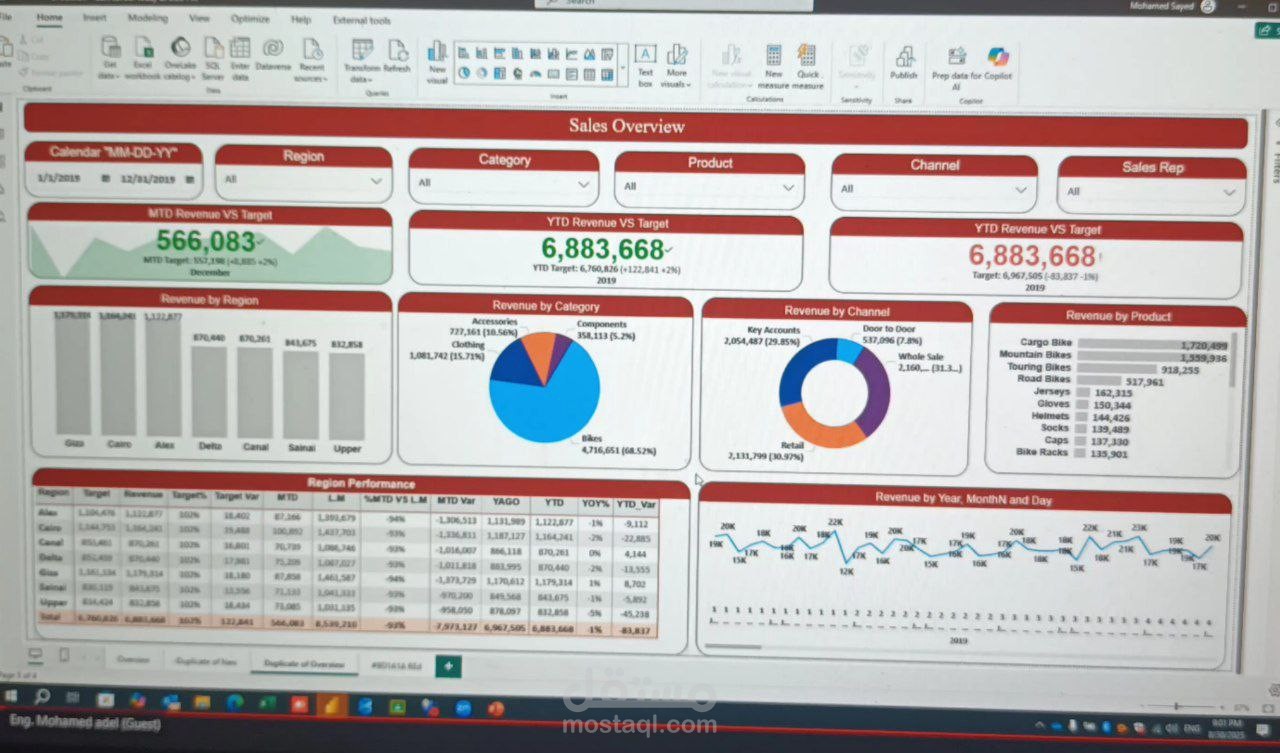
Designed and developed an interactive Power BI dashboard to monitor sales performance. The dashboard tracks MTD and YTD revenue versus targets, and provides insights by region, category, channel, and product. Visualizations include bar charts, pie charts, line charts, and detailed tables, allowing users to identify trends, compare performance against targets, and evaluate regional contributions. This report helped management quickly assess progress, highlight underperforming areas, and support data-driven decision-making.