Data analysis project with powerBI
تفاصيل العمل

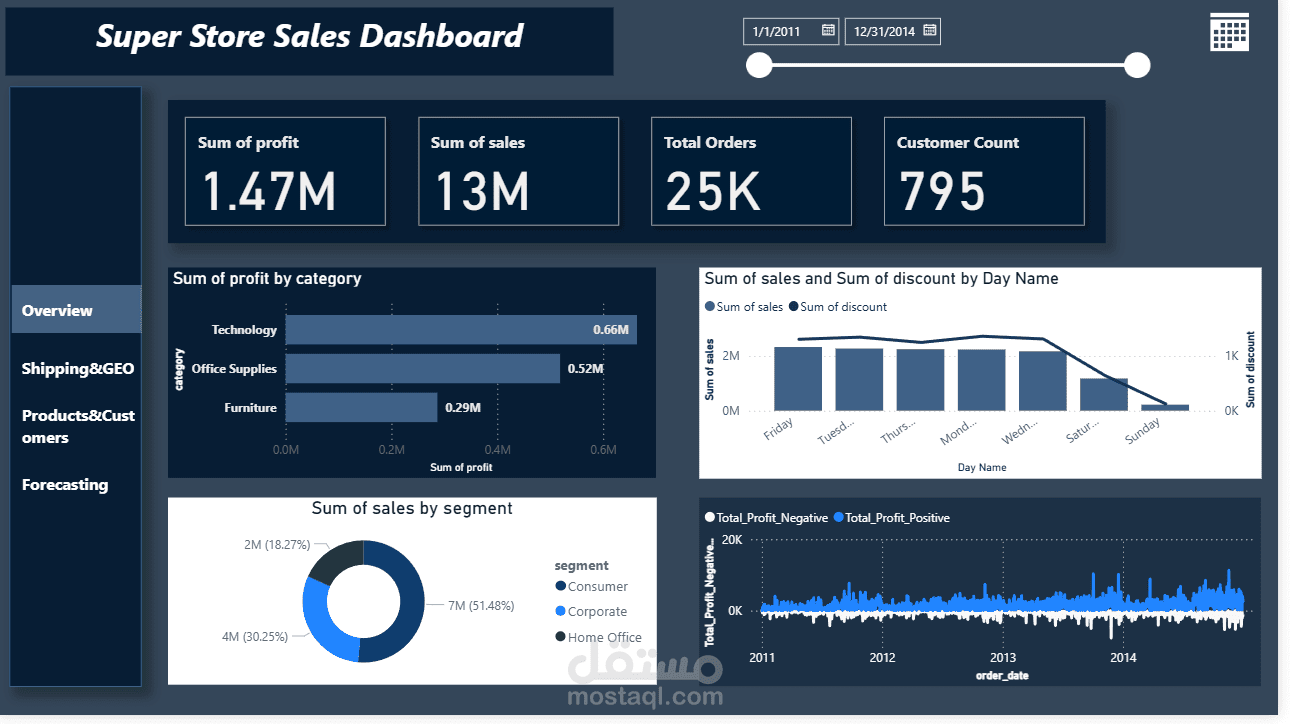
Super Store Sales Dashboard
This project presents an interactive sales dashboard built to analyze and monitor the performance of a retail store. The dashboard provides a comprehensive overview of sales, profit, orders, and customer behavior across multiple dimensions.
Key Features:
KPIs Tracking: Displays main metrics including total profit (1.47M), total sales (13M), number of orders (25K), and customer count (795).
Category Analysis: Profit breakdown across Technology, Office Supplies, and Furniture to identify the most profitable segments.
Sales by Day: Comparison of sales volume and discounts across weekdays to highlight customer purchasing trends.
Segment Insights: Pie chart visualization showing the contribution of Consumer, Corporate, and Home Office segments to overall sales.
Profit Trends Over Time: Line chart tracking positive and negative profit performance from 2011 to 2014.
Interactive Filters: Date range selector for drilling down into specific periods and analyzing seasonal trends.
Tools & Technologies Used:
Power BI (or Tableau/Excel – depending on what you used).
Data preprocessing and cleaning before visualization.
Business Intelligence best practices for interactive dashboards.
Outcome:
This dashboard enables stakeholders to quickly identify profitable categories, sales trends, and customer segments, supporting data-driven decisions to improve business performance and strategy.