Python analysis & Power Bi dashboard for COVID-19 dataset
تفاصيل العمل
Step 1 – Data Analysis with Python
• Cleaned & processed the dataset for accuracy.
• Performed EDA (Exploratory Data Analysis) to detect patterns and trends.
• Created insightful visualizations with Matplotlib & Seaborn.
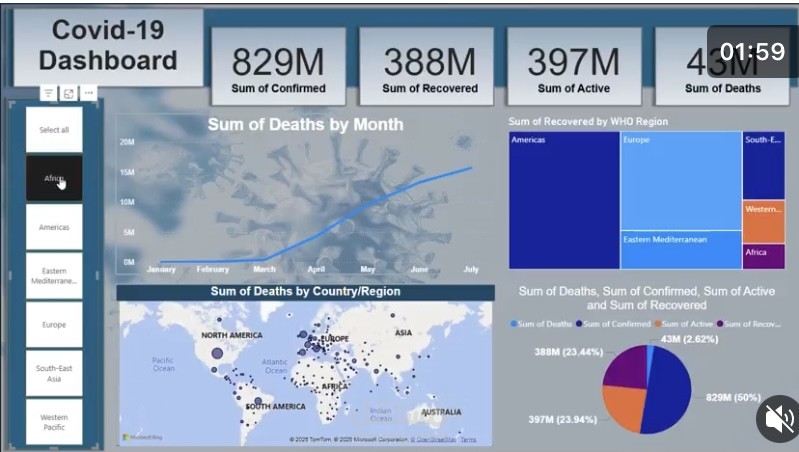
Step 2 – Interactive Dashboard in Power BI
• Built a dynamic Power BI dashboard to monitor global and country-level stats in real-time.\
• Integrated slicers, maps 01F
310 , and trend charts for a deeper exploration.
Key takeaway:
Combining Python for deep analysis + Power BI for interactive storytelling is a powerful way to communicate complex
data clearly and impactfully. | https://