Excel Sales Revenue Dashboard
تفاصيل العمل

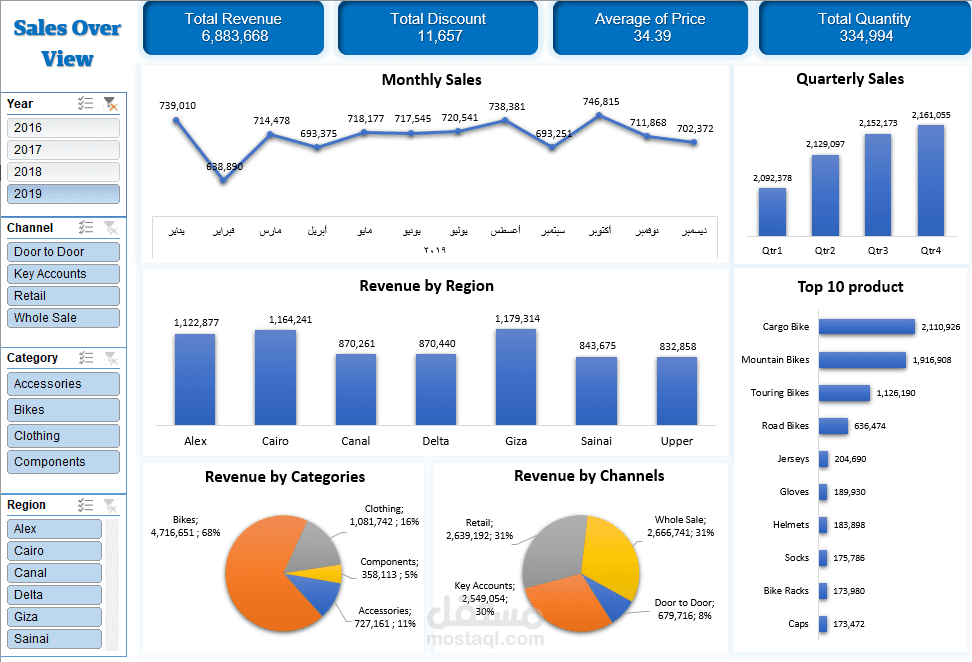
Designed and developed an interactive sales revenue dashboard using Excel to track key KPIs and uncover sales insights.
•Cleaned and transformed raw sales data with Power Query for accuracy and consistency.
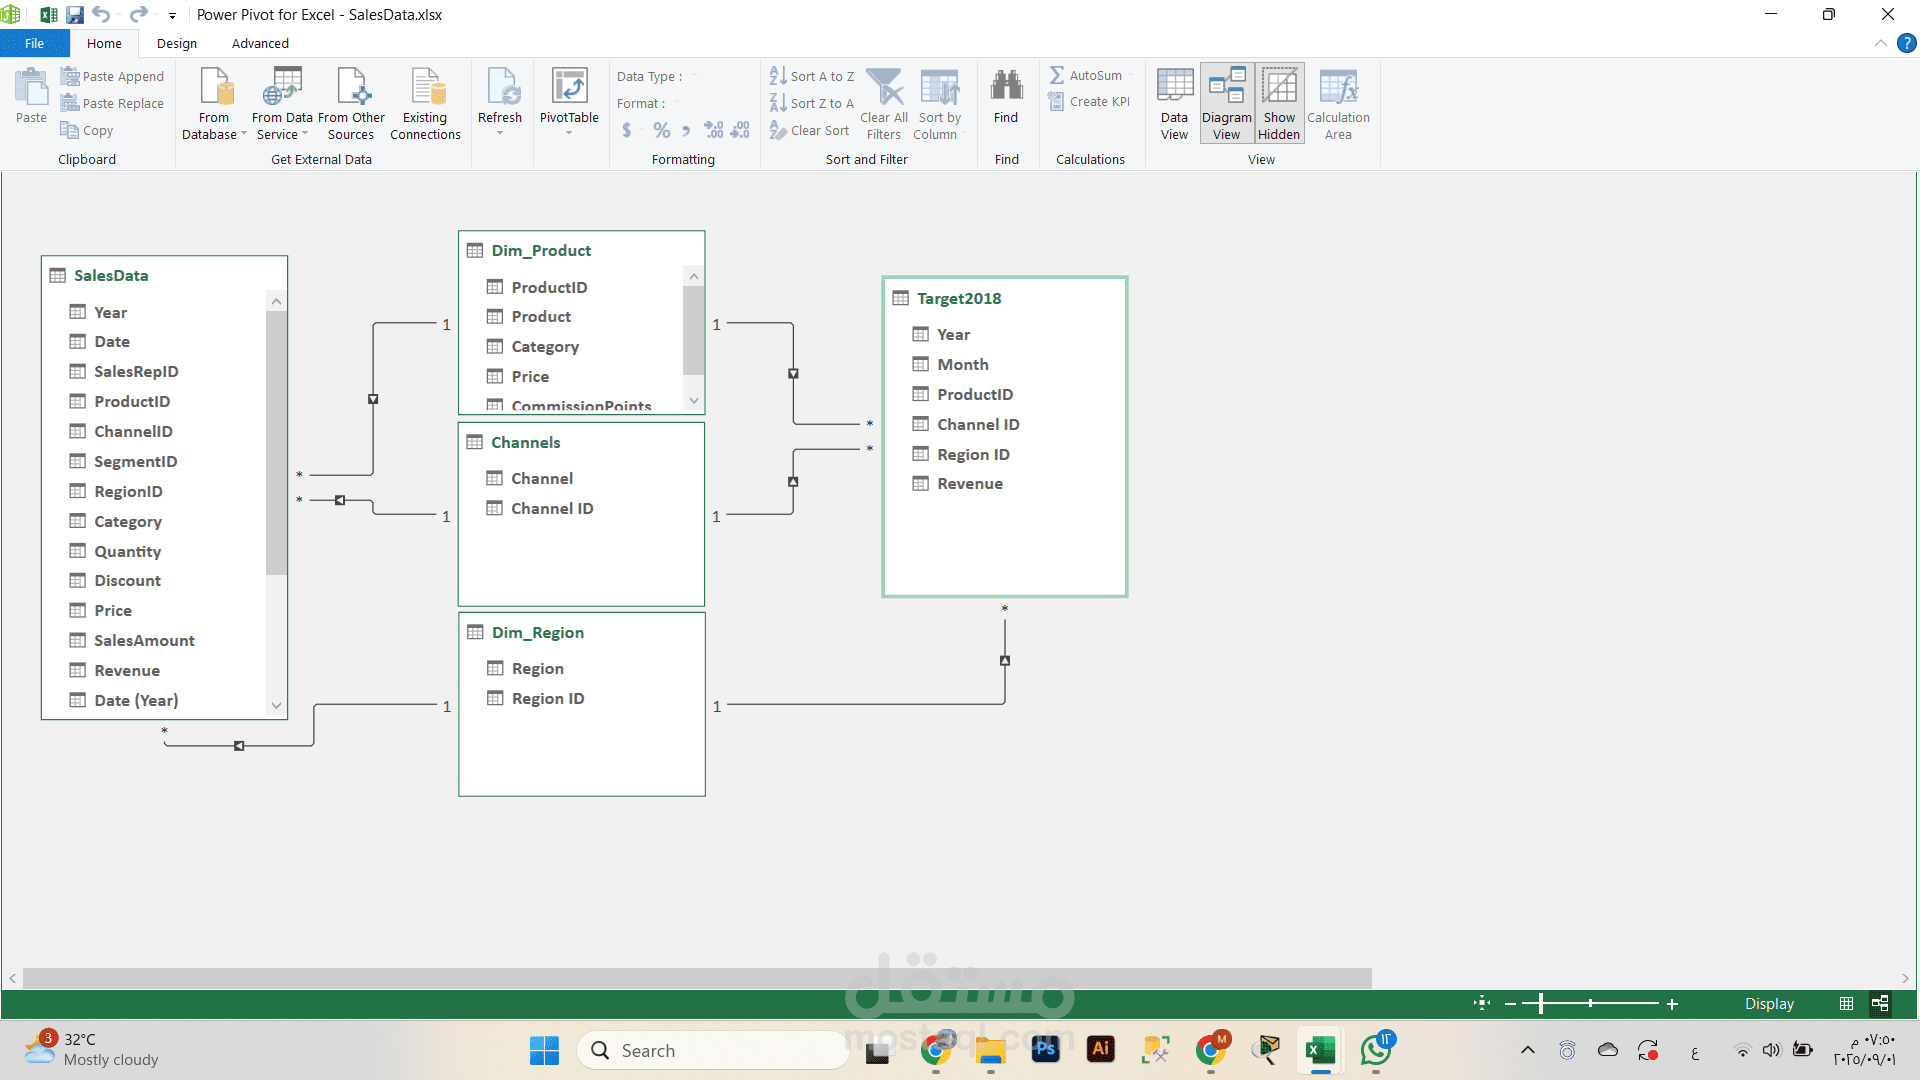
•Built a dynamic data model with Pivot Tables & Slicers for filtering by year, channel, category, and region.
•Designed KPIs: Total Revenue 6.9M, Quantity 335K, Avg. Price 34.4, Discounts 11.6K.
•Highlighted key insights: Bikes = 68% of sales (4.7M), Retail = 3.2M revenue, and top products (Cargo Bike 2.1M, Mountain Bike 1.9M).
•Reduced manual reporting effort by automating analysis and enabling faster decision-making.