Power BI Dashboard
تفاصيل العمل

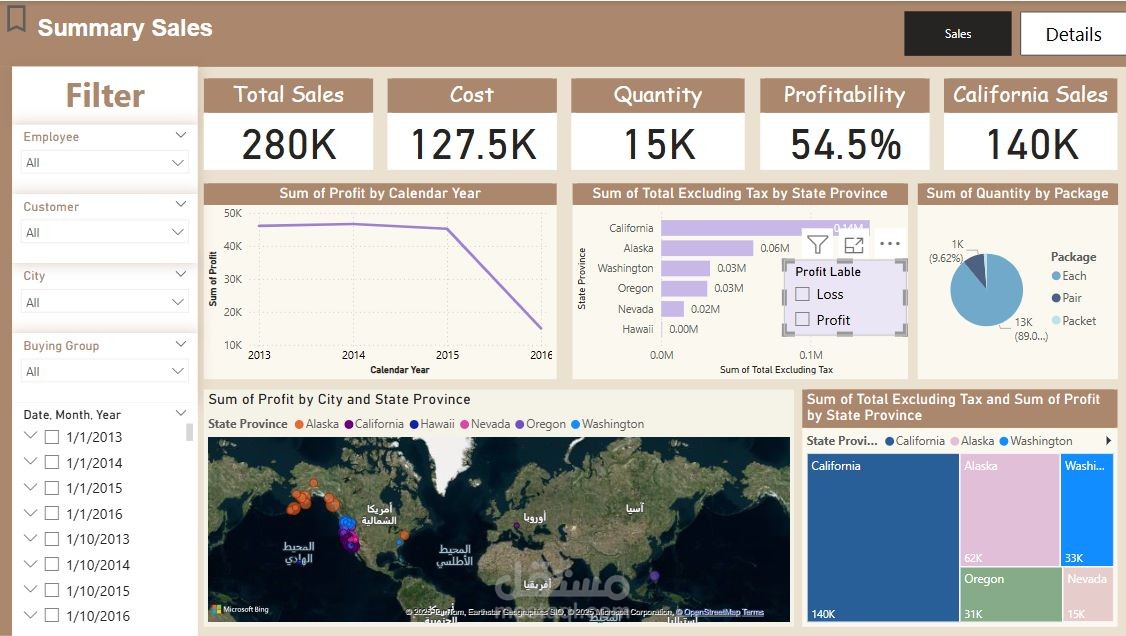
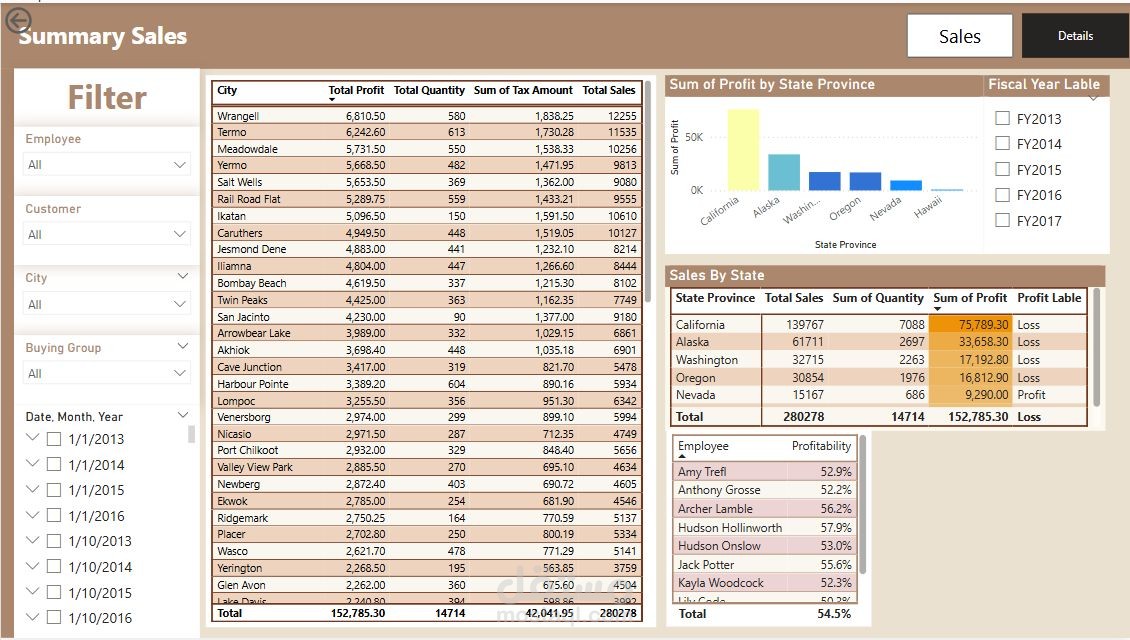
Designed and developed a complete sales dashboard using Power BI and Excel. The goal was to help users explore sales trends and key metrics easily.
•Cleaned and organized over 5,000 rows of sales data to prepare it for analysis.
•Using Power BI, built interactive visualizations such as bar charts, line graphs, and slicers to highlight important insights.
•Applied DAX formulas to calculate business metrics like total sales, MTD values, and performance comparisons.
•Reduced manual reporting time by 40%
•Published the dashboard using Power BI Service for sharing and access.
•Designed dashboards used by a team of 10+ users for weekly sales review