Freelancer data analysis
تفاصيل العمل
Through this project, I was able to:
Understand the raw data deeply
Create meaningful measures to extract the core insights
Build a proper data model linking fact and dimensioning tables seamlessly
This was accomplished under the guidance of Eng. Ibrahim Al-Nwasany, to whom I'm truly grateful.
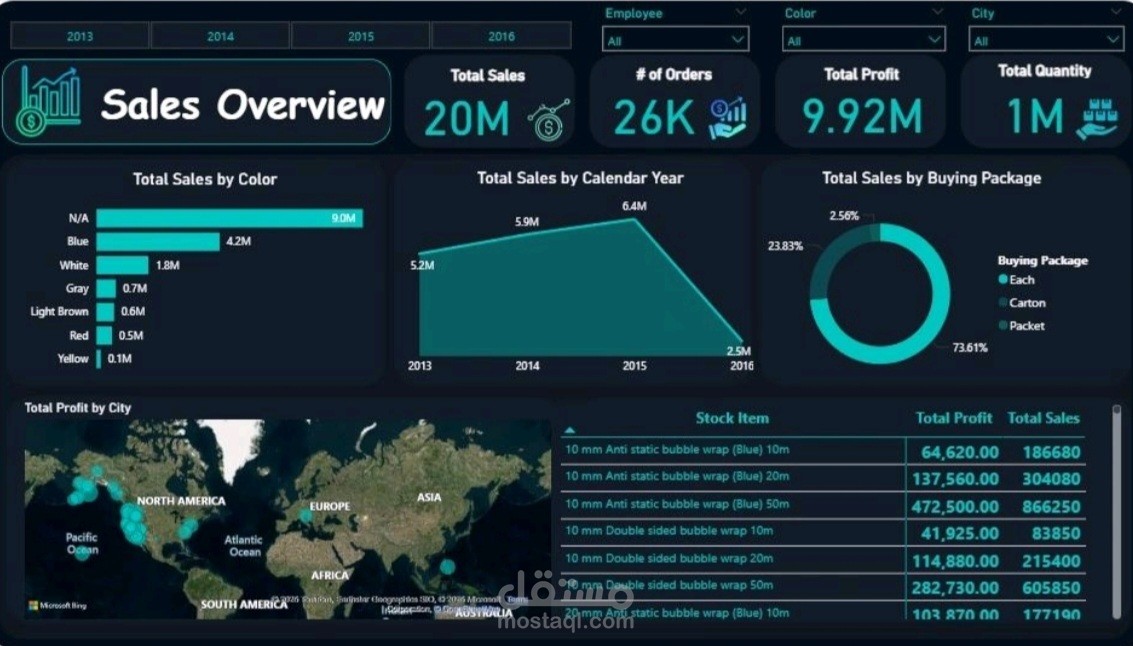
Dashboard Overview:
KPIs: Total Sales (20M), Orders (26K), Profit (9.92M), Quantity (1M)
Trends: Sales over the years (2013-2016) highlighting key growth and drop points
Breakdowns: By product color, purchasing package, and city
Geography: Profit distribution across global regions
Stock Analysis: Profitability and sales per stock item
This dashboard is not just about visuals; it's about transforming complex datasets into insights that enable better business decisions.