Freelancer
تفاصيل العمل

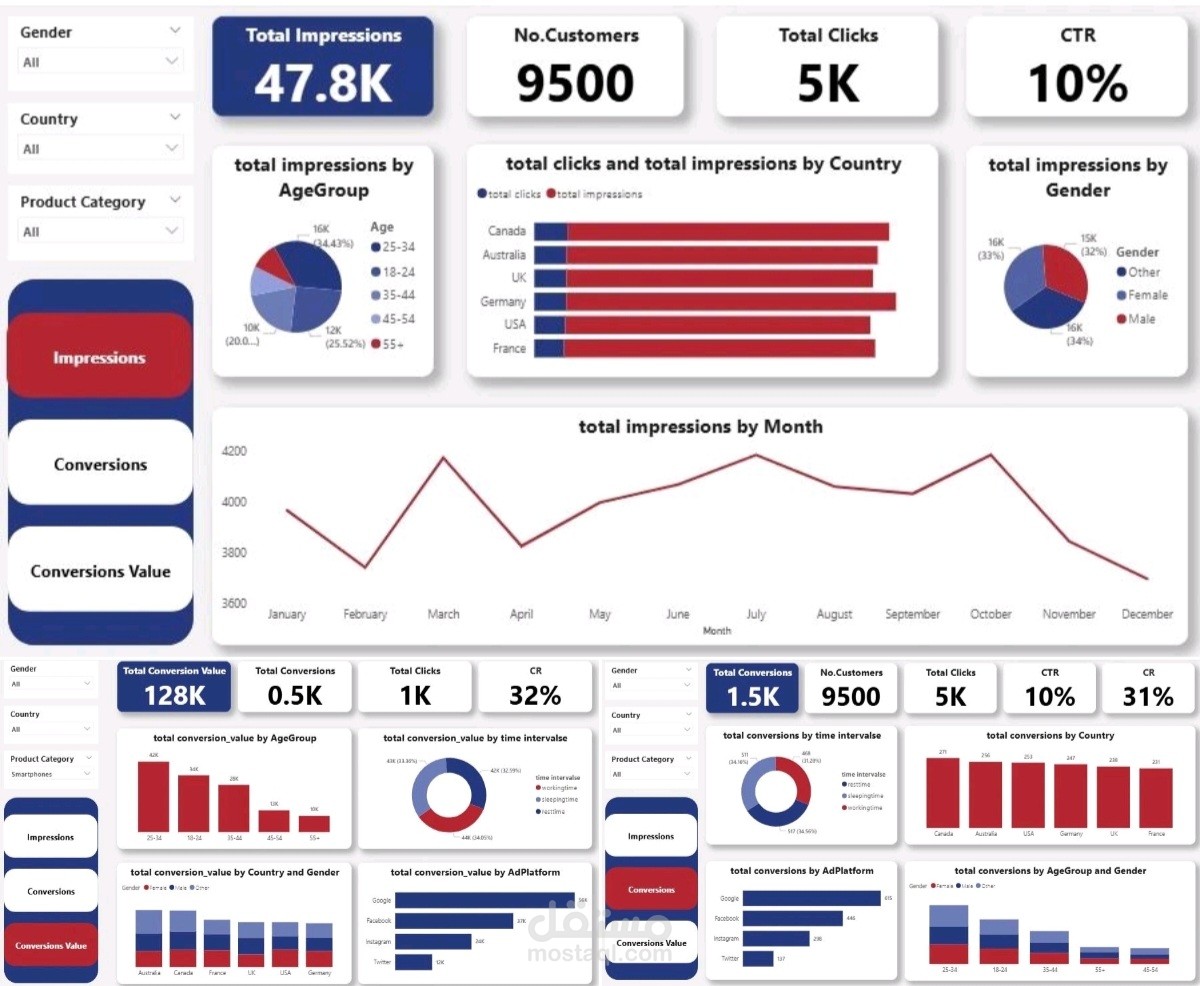
+Marketing data can reveal powerful insights if you know where to look. +
Here's my second dashboard I built to analyze campaign performance and answer key questions like:
- Which platforms have the highest CTR and CR?
- Which age groups drive the highest conversions and value?
- Which countries perform best in conversions and value, and are there gender differences?
- Which time intervals deliver the highest conversion value?
From this analysis, I extracted insights about the most effective ad platforms, the strongest customer segments by age, the top-performing regions, and the best time intervals for conversions.
> > Steps I followed:
1. Data Collection & Understanding
2. Data Cleaning & Preparation
3. Data Modeling By Power Query
4. Exploratory Data Analysis (EDA)
5. Dashboard Design using Power BI
6. Generating Insights & Recommendations
This project highlighted how Data Analysis can uncover patterns, explain performance, and guide better business decisions.