Data Visualization
تفاصيل العمل
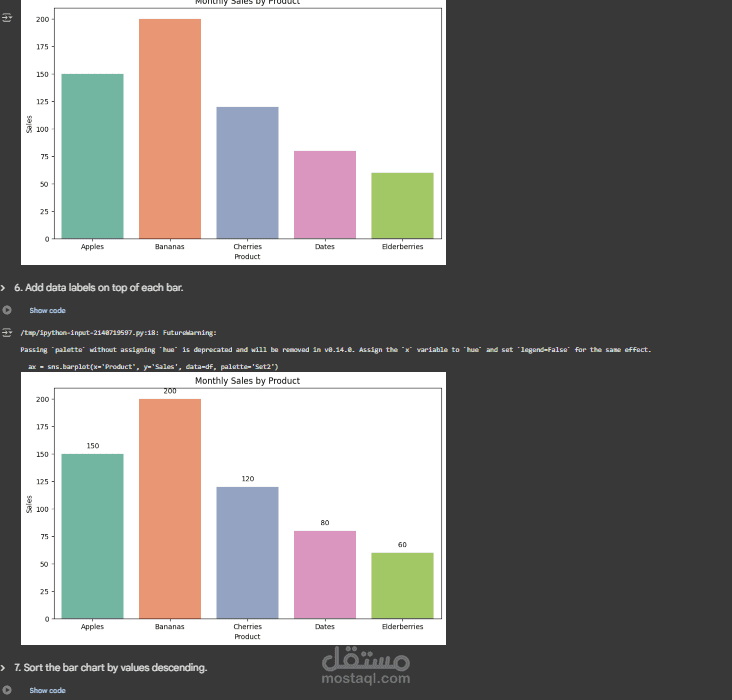
This project involved working on a data visualization assignment where the main objective was to transform raw data into clear and meaningful visual insights. Using different charts and graphs, I highlighted key patterns, trends, and comparisons within the dataset. The project focused on making complex information easier to understand, improving decision-making, and presenting findings in a visually engaging way.