Sales Company Dashboard
تفاصيل العمل
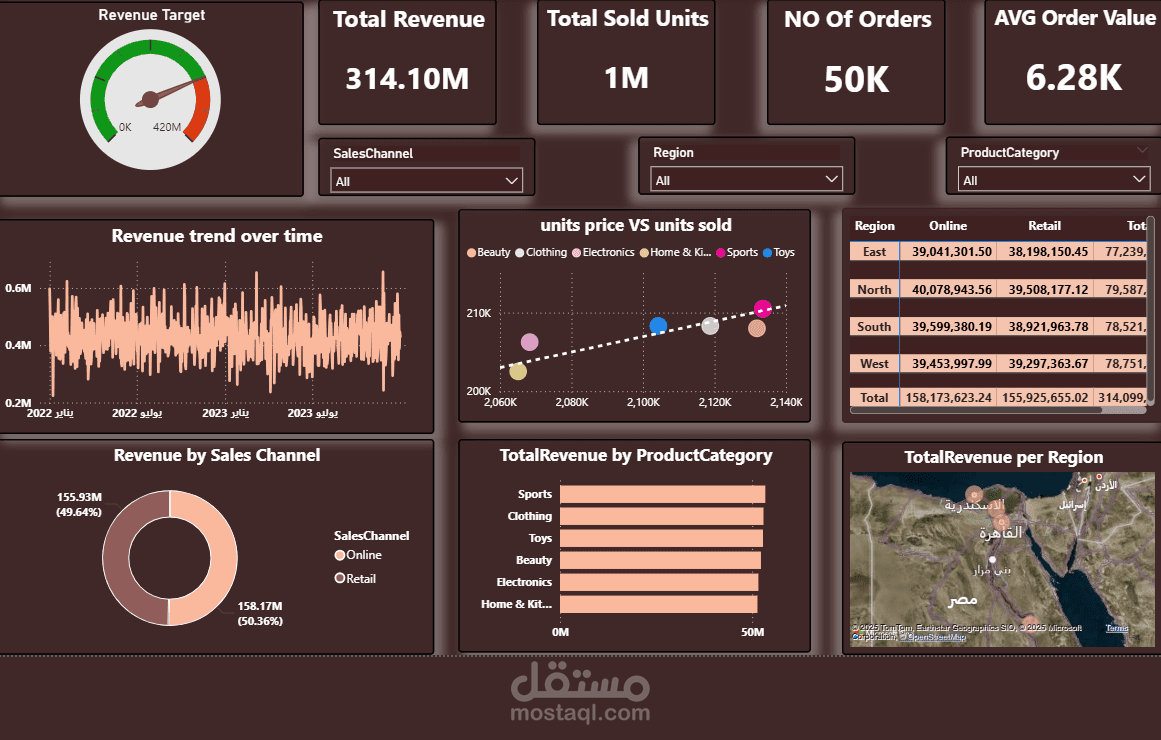
This dashboard was designed to transform raw sales data into clear business insights.
The deliverables included:
Cleaned & modeled dataset for accurate analysis
Interactive visuals for easy decision-making
KPIs & performance tracking across regions and channels
Some of the key KPIs showcased:
Total Revenue vs Target (progress tracking with gauge charts)
Average Order Value (AOV) to measure customer value
Revenue split Online vs Retail for channel performance
Units Sold trends with regional insights
Price vs Units Sold scatter to analyze price-performance
With this dashboard, decision-makers can see where they are hitting goals, identify gaps instantly, and explore data interactively.