data analyst
تفاصيل العمل

Project Description:
I worked individually on a BMW Car Sales Analysis (2010–2024) project using data collected from Kaggle. The workflow started with data cleaning and preparation in Excel, and the insights were visualized through an interactive Power BI dashboard.
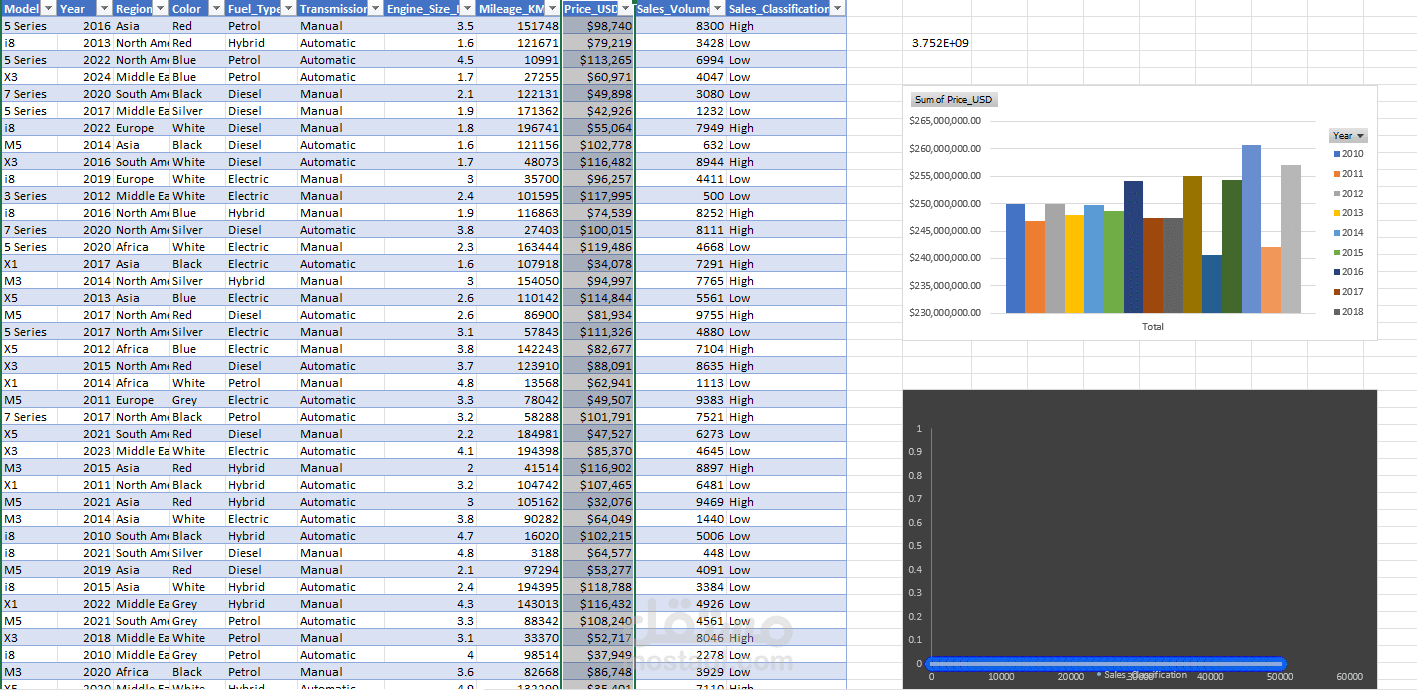
My Workflow:
Excel: Cleaned and structured raw BMW sales data.
Power BI: Built dynamic visualizations and KPIs to analyze trends.
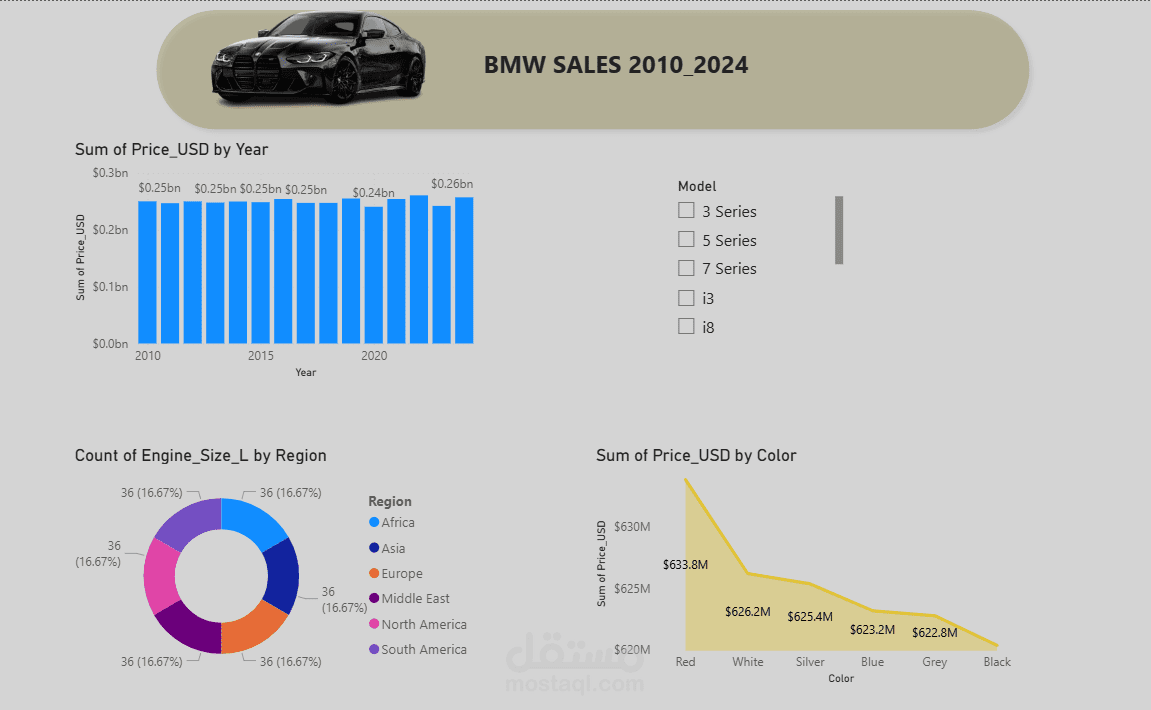
Dashboard Features:
Yearly Sales Trend: Total sales value (USD) from 2010 to 2024.
Regional Analysis: Engine size distribution by region (Africa, Asia, Europe, Middle East, North & South America).
Model Filtering: Ability to filter data by BMW models (3 Series, 5 Series, 7 Series, i3, i8).
Sales by Color: Comparison of total sales by car color (Red, White, Silver, Blue, Grey, Black).
Impact:
This project highlights key sales insights such as top-performing car colors, yearly sales trends, and regional engine distribution, helping to understand global market behavior for BMW cars.