data analyst
تفاصيل العمل

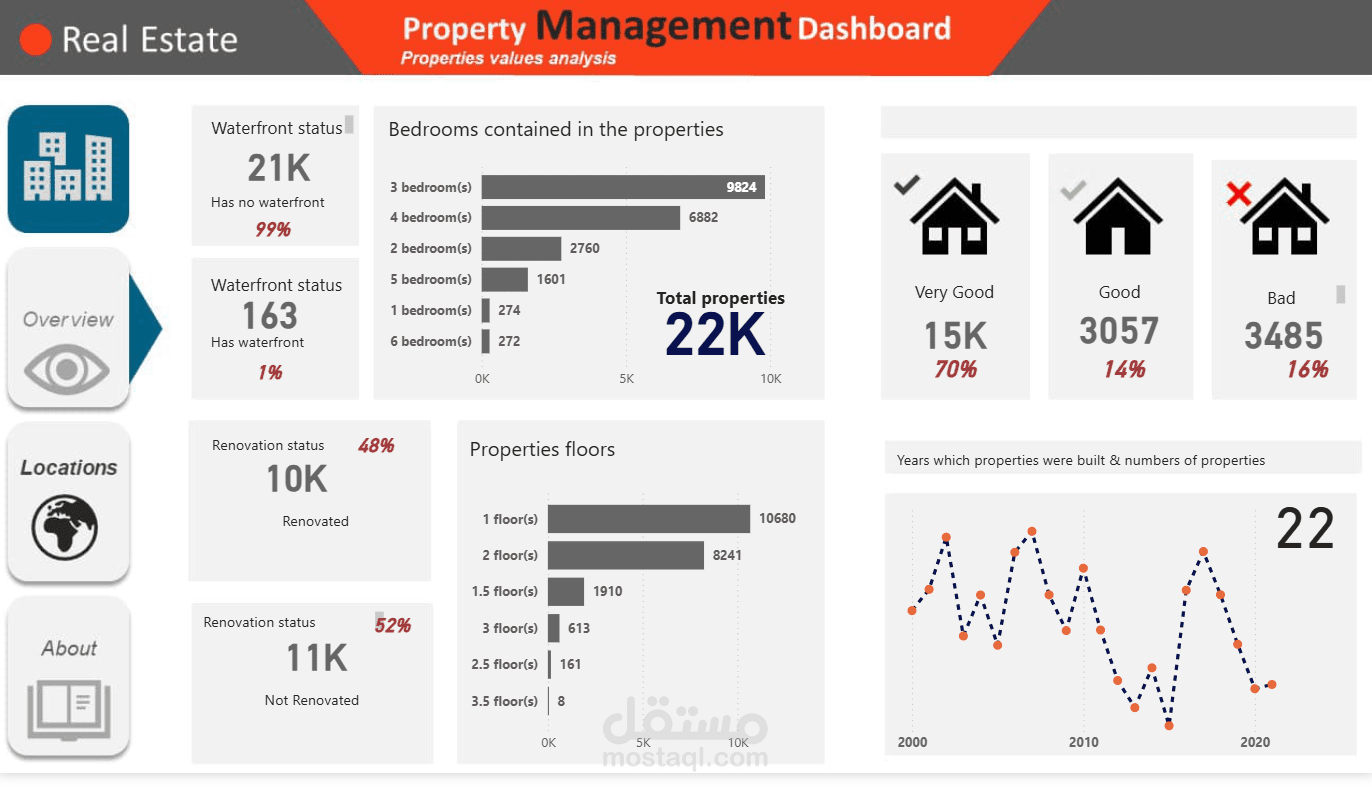
I worked with my team on a Real Estate Property Management Dashboard project.
We started by cleaning the raw dataset in Excel, then performed data analysis with Python, and finally built an interactive Power BI dashboard to visualize property insights.
My Contribution & Workflow:
Excel: Handled missing values, duplicates, and standardized property data.
Python: Conducted exploratory data analysis and feature preparation.
Power BI: Designed a dashboard that provides a full overview of property status and conditions.
Dashboard Features:
Waterfront Status: Distribution of waterfront vs. non-waterfront properties.
Bedrooms Analysis: Breakdown of properties by number of bedrooms.
Property Condition: Classification into Very Good, Good, Bad with percentages.
Renovation Status: Comparison between renovated and non-renovated properties.
Property Floors: Analysis of properties by number of floors.
Construction Year Trend: Timeline showing when properties were built.
Impact:
The dashboard helps real estate managers and investors quickly assess property conditions, renovation needs, and market distribution, enabling data-driven decisions for property management.