data analyst
تفاصيل العمل
I worked with my team on a Car Sales Data Analysis & Visualization Project.
We started from raw data in Excel, performed data cleaning and preprocessing, then used Python for analysis, and finally built an interactive Power BI dashboard to deliver insights.
My Contribution & Workflow:
Excel: Cleaned and structured raw sales data for consistency.
Python: Applied data transformation, validation, and exploratory analysis.
Power BI: Designed a professional dashboard with KPIs, charts, and interactive filters.
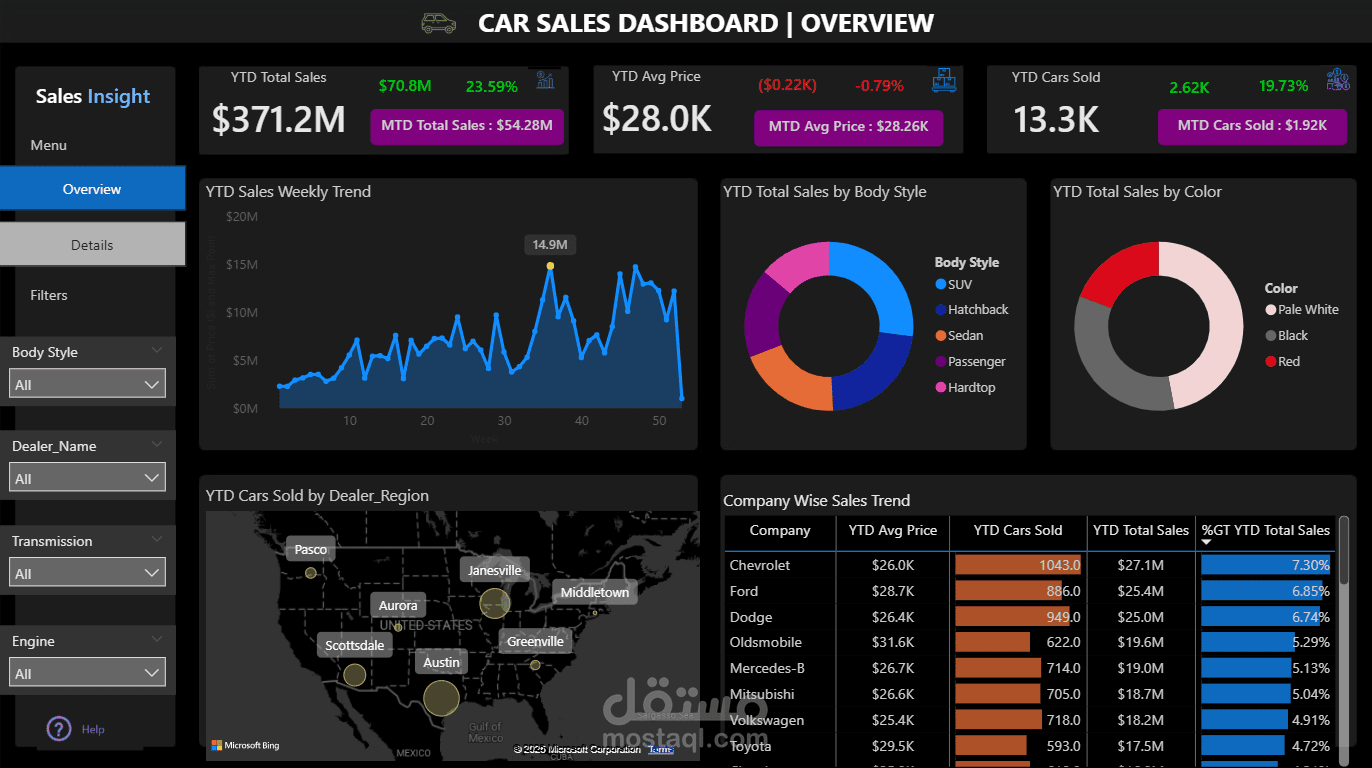
Dashboard Features:
Key Metrics: Total Sales, Avg Price, Cars Sold with YTD & MTD comparison.
Sales Trends: Weekly sales trend line chart.
Categorical Insights: Sales breakdown by Body Style & Color.
Geographical Analysis: Cars sold by Dealer Region (map visualization).
Company-Wise Performance: YTD Avg Price, Cars Sold, Total Sales, Market Share %.
Impact:
This dashboard helps decision-makers monitor performance, identify top-performing brands and regions, and make data-driven business decisions.