Sales Performance Dashboard with Power BI
تفاصيل العمل

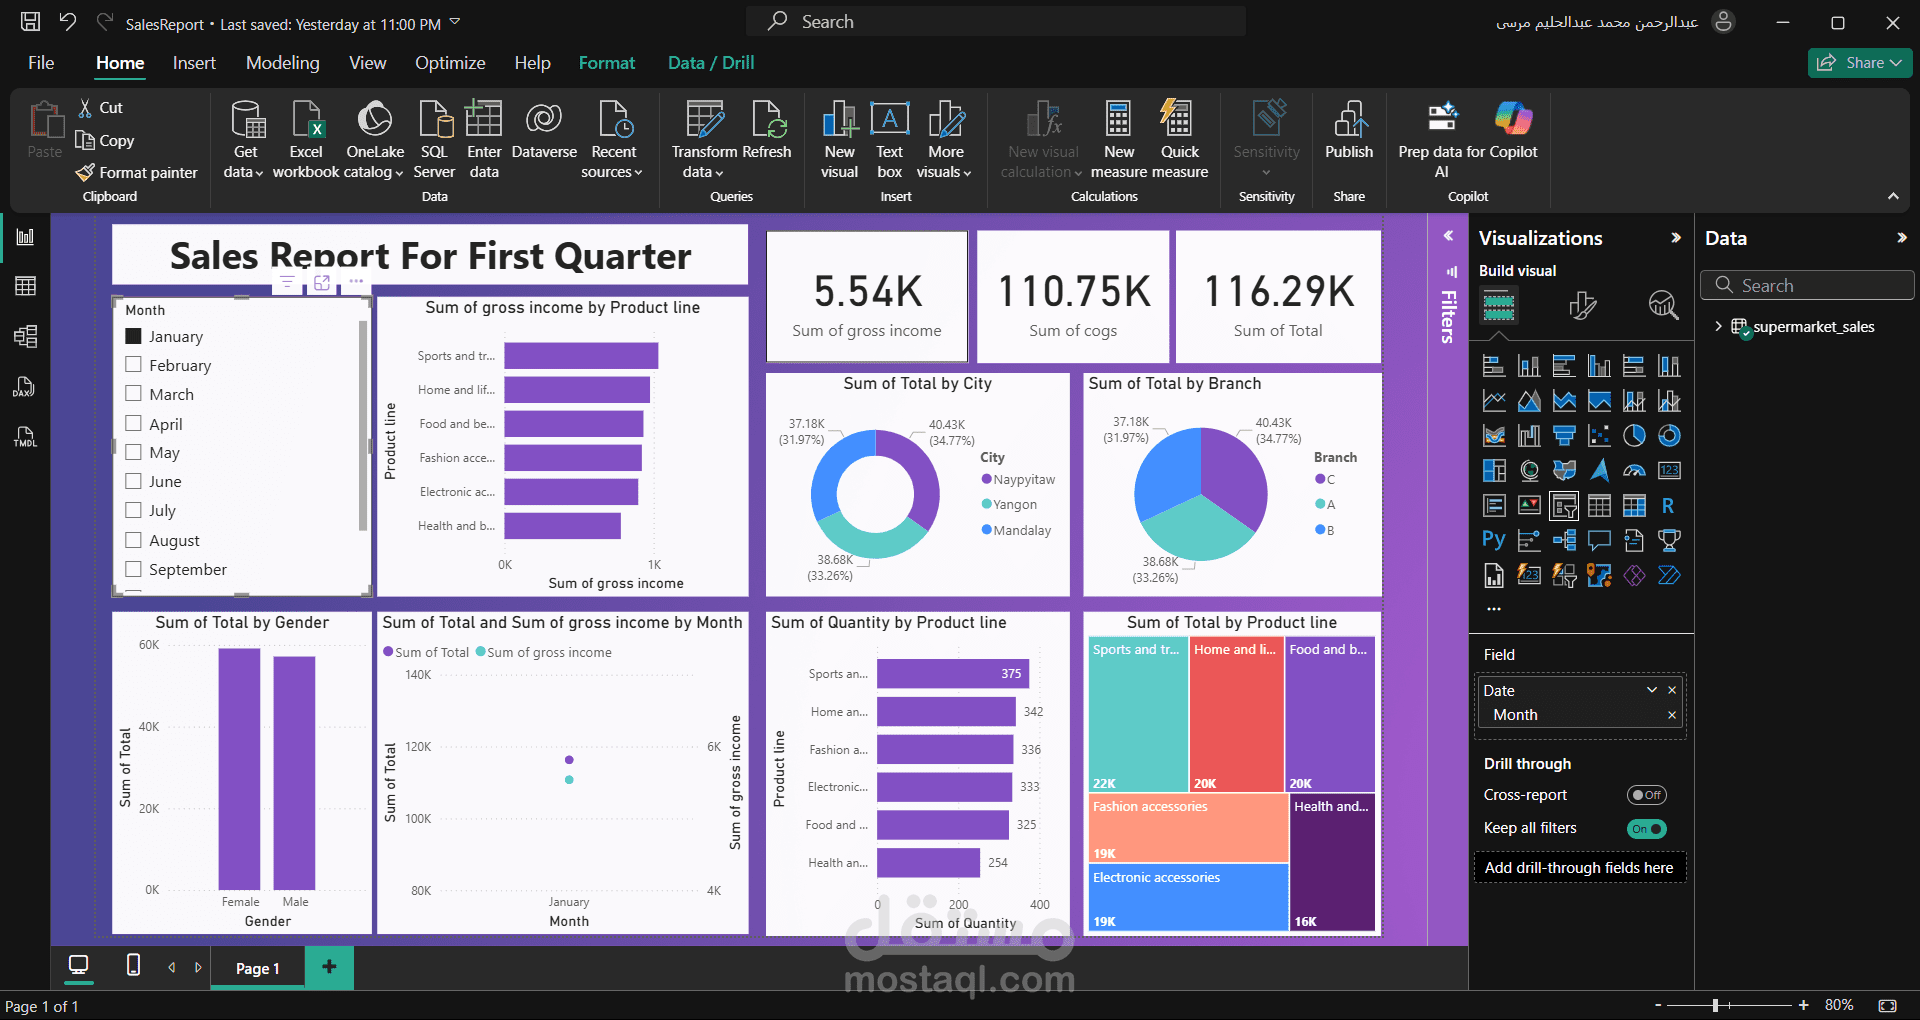
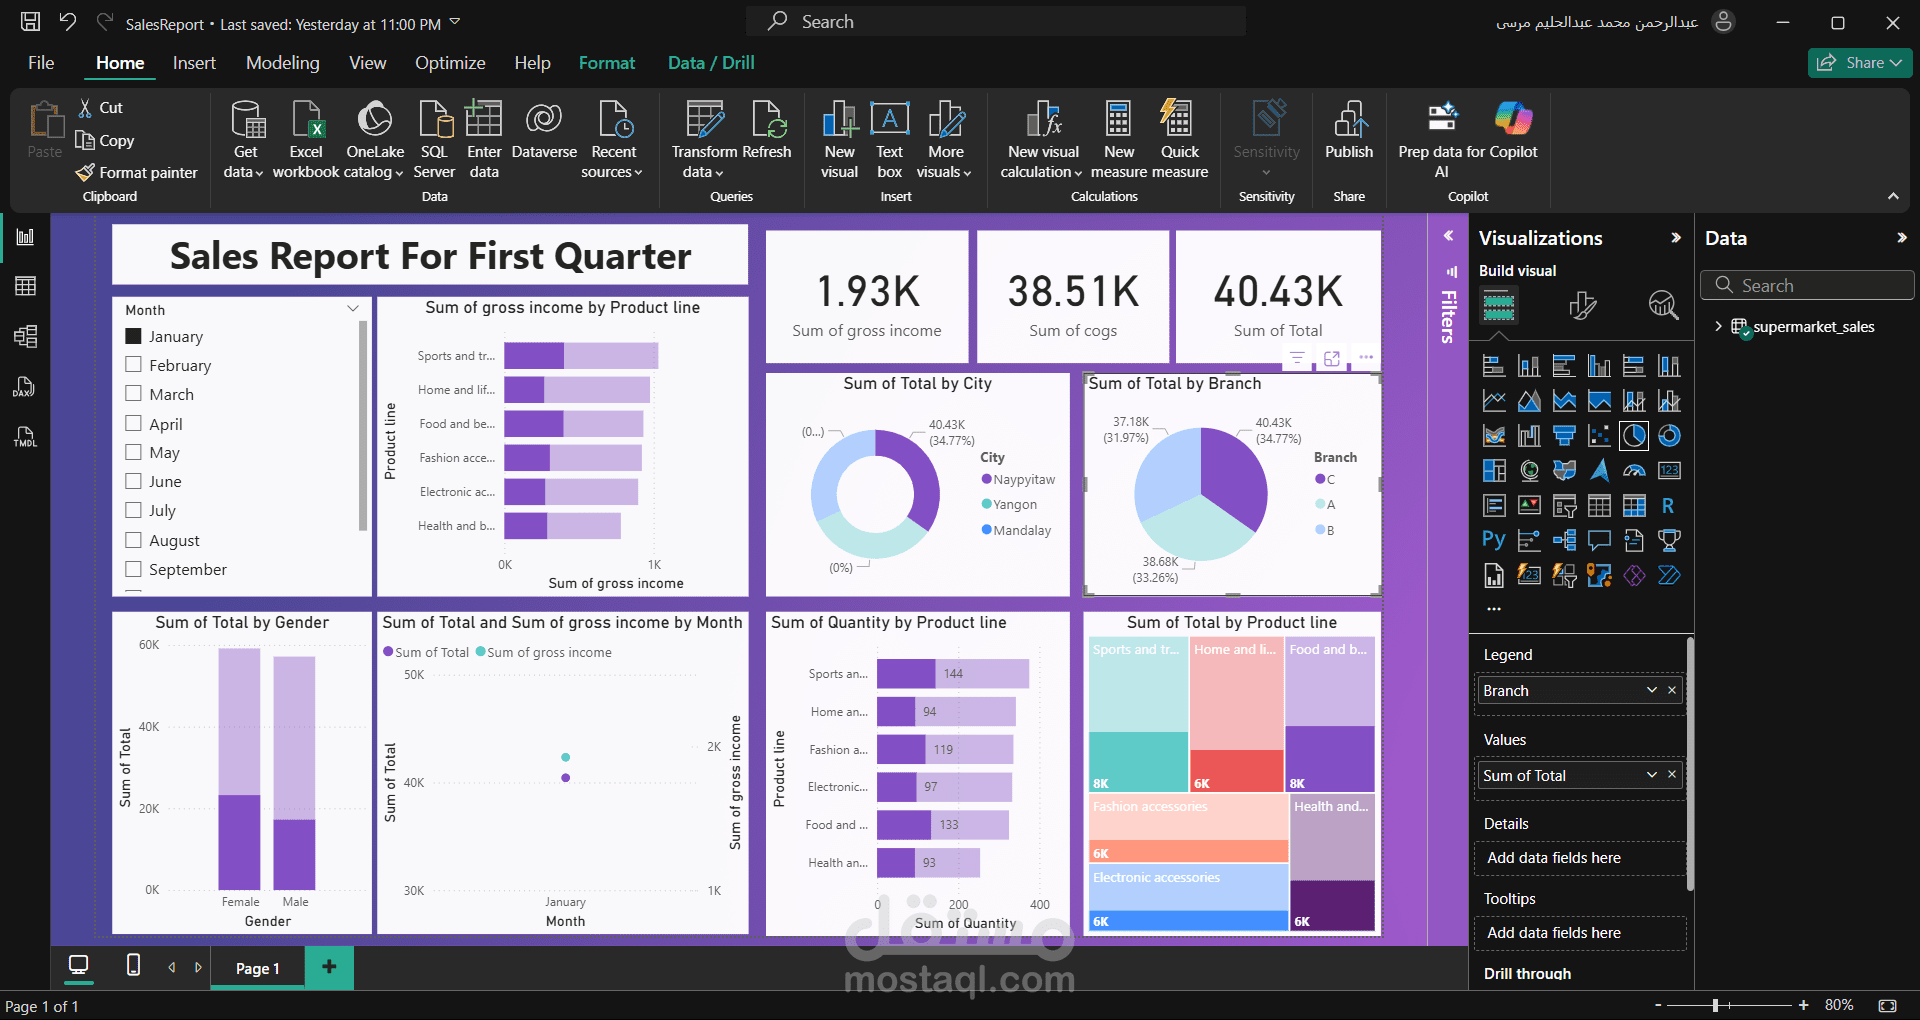
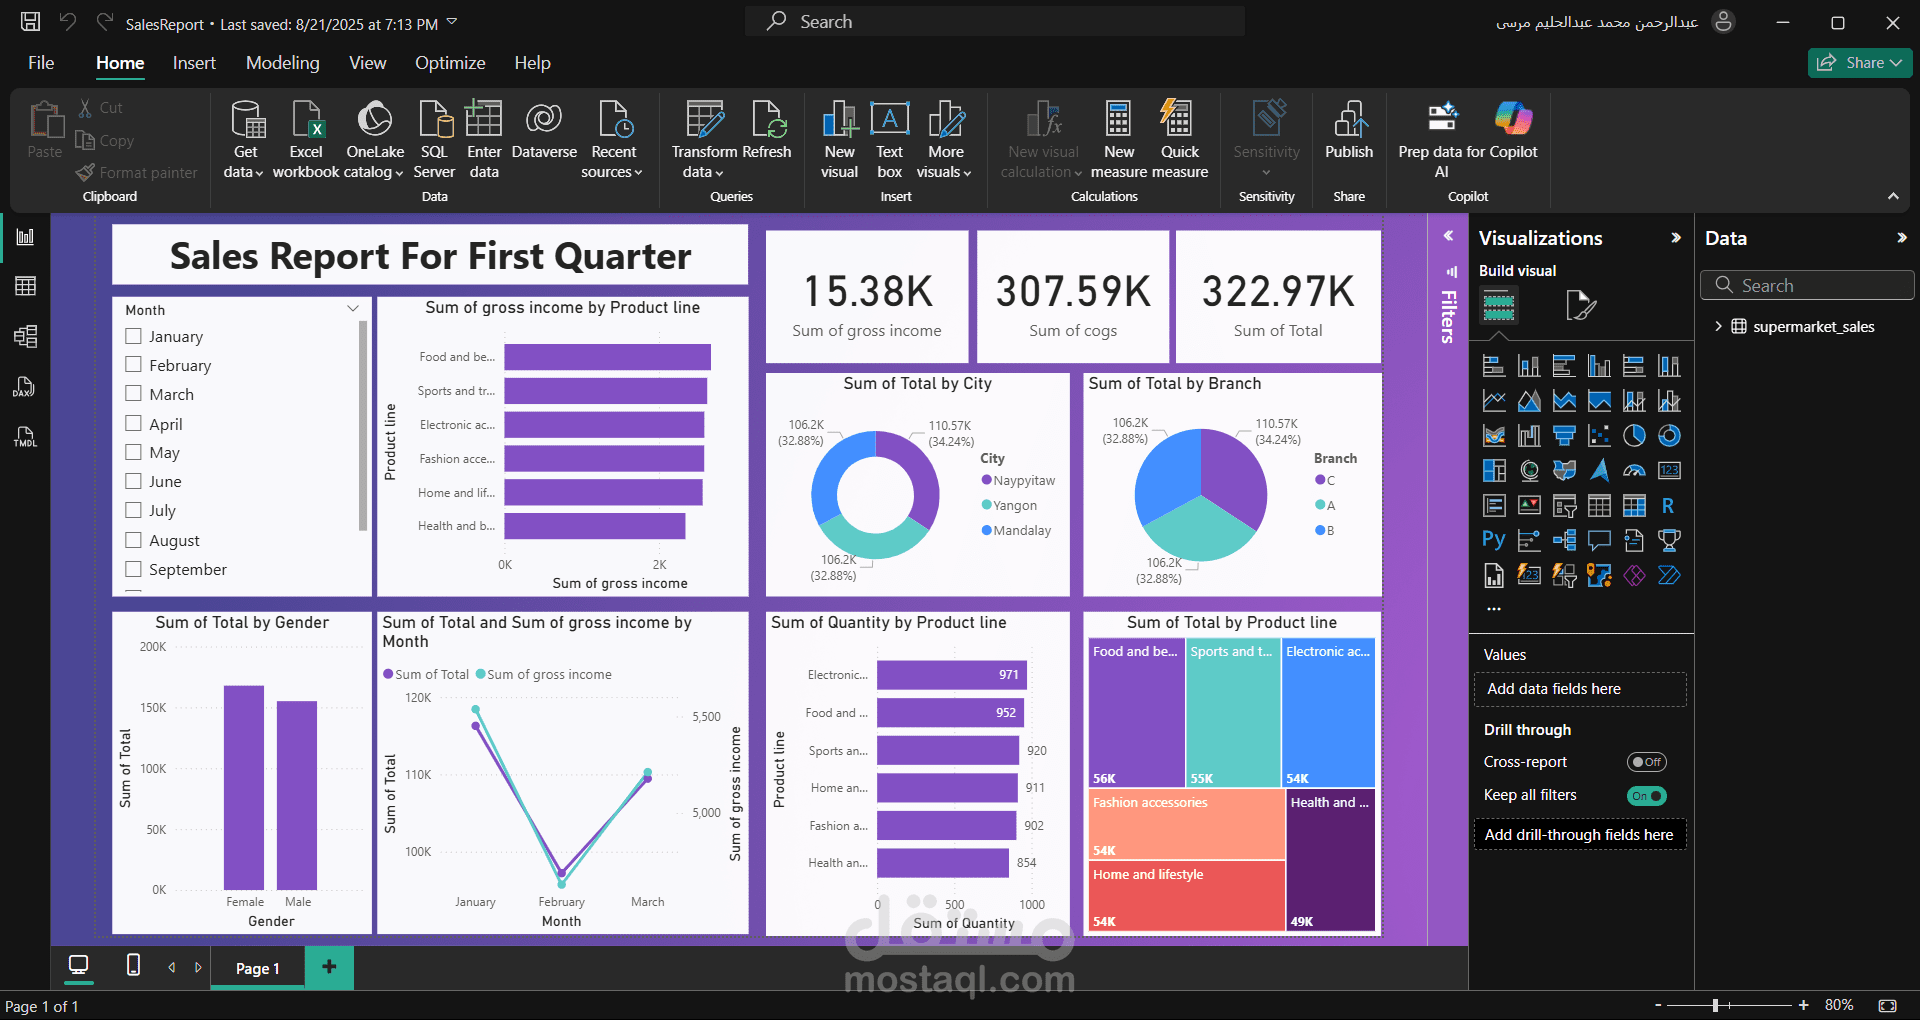
Designed and developed an interactive Power BI dashboard to analyze and visualize sales data. The dashboard included KPIs such as total sales, revenue by region, top-performing products, and customer trends. Integrated multiple data sources, cleaned raw datasets, and created dynamic visualizations with slicers and drill-through features. Delivered a solution that helped stakeholders track performance and make data-driven decisions.