E_commerce performance
تفاصيل العمل

From Data to Decisions… A 3D E-Commerce Dashboard
In the world of e-commerce, numbers are the fuel.
But without clear visual analysis, they remain just meaningless figures.
This is where I come in as a Data Analyst. I designed an E-Commerce Performance Dashboard using Power BI, featuring 3 main pages:
Customers – Sales – Marketing, each telling a part of the success story.
Page One: Customers
Total Customers: 1468
Quantity Sold: 238K
Sales after Tax: 3.28M
Shipping Fees: 557K
Geographic Distribution:
Top City: Chicago (84K)
Lowest City: Washington DC (12K)
? Gender: Men (62.17%) – Women (37.83%)
Detailed table showing customer and order data (SKU, quantity, price, discounts, taxes).
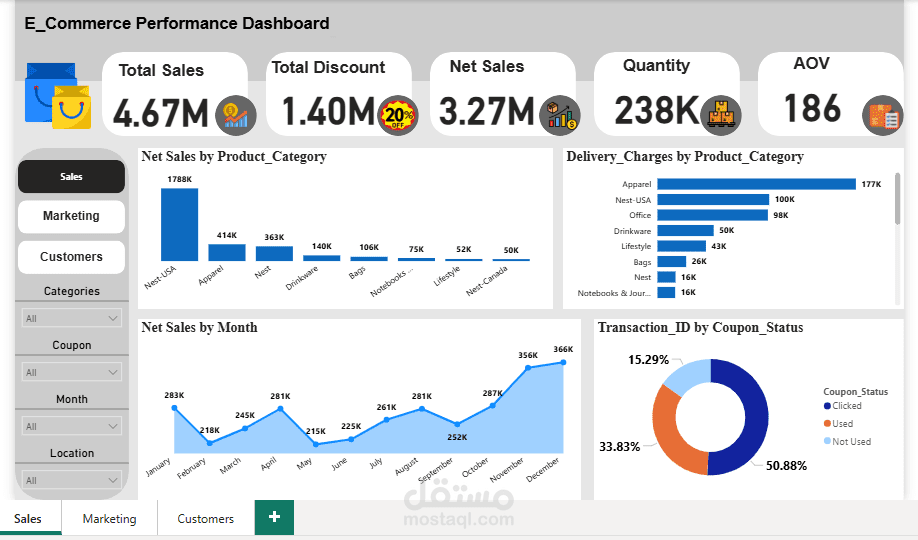
Page Two: Sales
Total Sales: 4.67M
Net Sales: 3.27M (after 1.40M discounts)
Average Order Value (AOV): 186
Top Selling Categories:
Nest-USA (1.788M)
Followed by Apparel (414K)
Monthly Analysis:
Highest Month: December (366K)
Lowest Month: February (218K)
Coupon Status:
Clicked (50.88%) – Used (33.83%) – Not Used (15.29%)
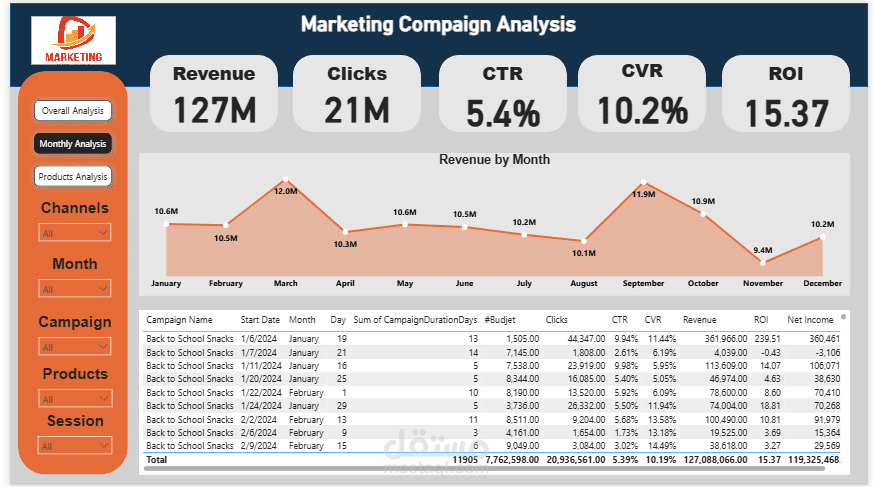
Page Three: Marketing
Online Spending: 695.6K
Offline Spending: 1.04M
Total Marketing Spend: 1.73M
Return on Investment (ROI): 89%
Highest Marketing Spend: December (199K) – Lowest: July (120K)
? Highest Tax Category (GST): Apparel (3.3K)
Map showing global sales distribution.
Tools Used:
Power BI & DAX & Data Modeling – Data design and analysis
Excel & SQL – Data cleaning and preparation
Outcome:
A comprehensive dashboard combining sales, customers, and marketing data in one place, enabling faster and more accurate decision-making.
#DataAnalytics #PowerBI #DataVisualization #BusinessIntelligence #Ecommerce #DashboardDesign #DataDriven