تحليل بيانات لمصنع حديد
تفاصيل العمل
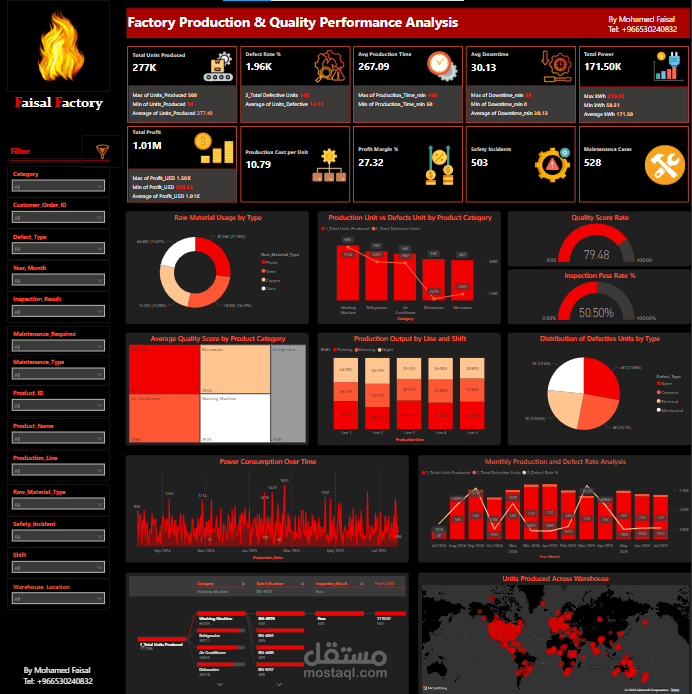
محلل بيانات Factory Production & Quality Performance Analysis
In this Power BI dashboard, I analyzed a manufacturing dataset covering:
Total Units Produced
️ Defective Units & Defect Rate
Production by Line & Shift
Power Consumption Trends
? Quality Score by Product Category
? Raw Material Usage
Warehouse Distribution
️ Maintenance and Safety Incidents
I used various visuals including:
Line & Clustered Column Charts
Bar Charts & Pie Charts
Treemaps, Gauges, and Area Charts
Tools: Power BI, DAX Measures, Excel
Key Takeaways:
Identified top defect types by category
Tracked power usage patterns across time
Analyzed product performance across shifts and production lines
I'm happy to connect and discuss more about manufacturing analytics and Power BI projects!
Link of the report: https://app.powerbi.com/v...