Sales Analysis Dashboard Explanation
تفاصيل العمل
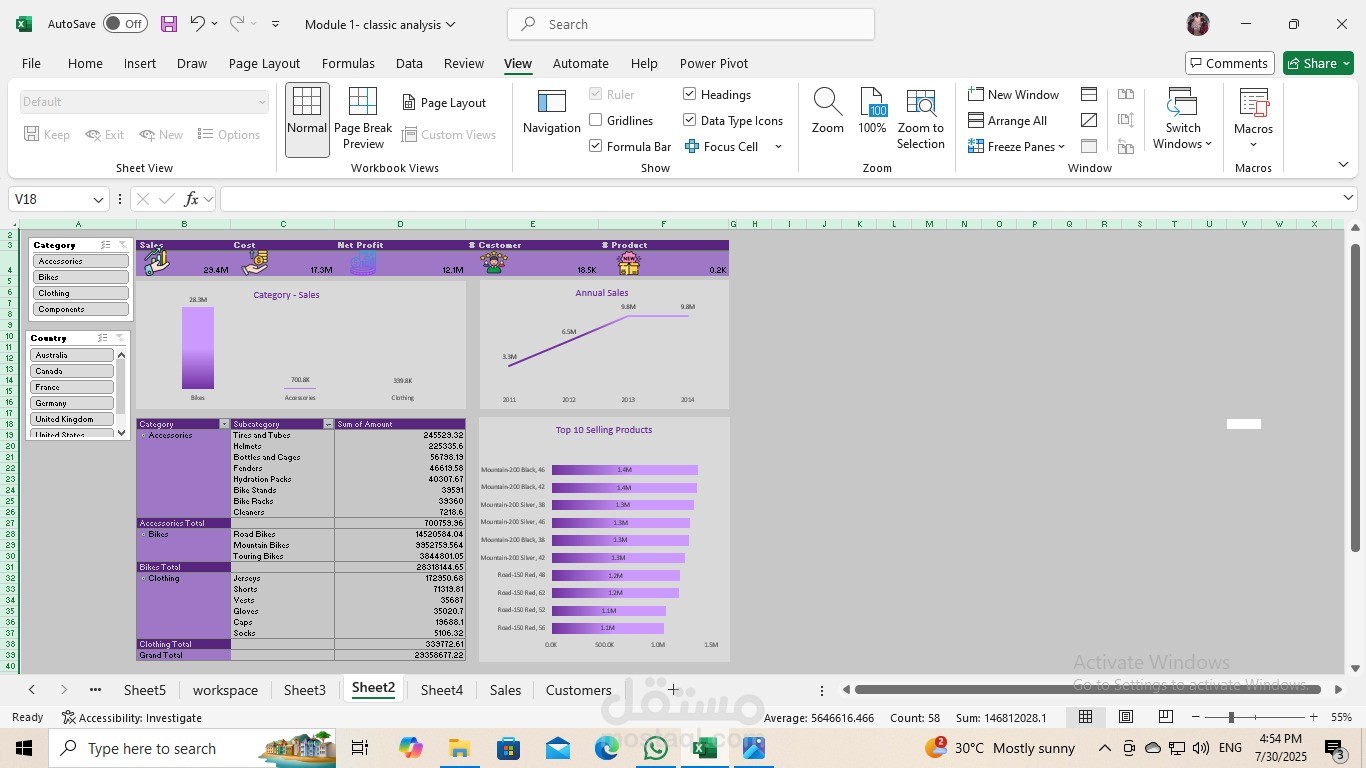
This dashboard provides a comprehensive overview of company sales performance by category, country, and product. It is designed to help management quickly evaluate sales, costs, profits, and customer behavior.
Key Metrics (Top Section)
Sales (23.4M): Total revenue generated.
Cost (17.3M): Total expenses related to products sold.
Net Profit (11.3M): Difference between sales and cost.
Customers (12.1M): Total number of customers served.
Products (18.5K): Total quantity of products sold.
Orders (0.2K): Total number of customer orders.