Sales & Revenue Analysis Dashboard
تفاصيل العمل
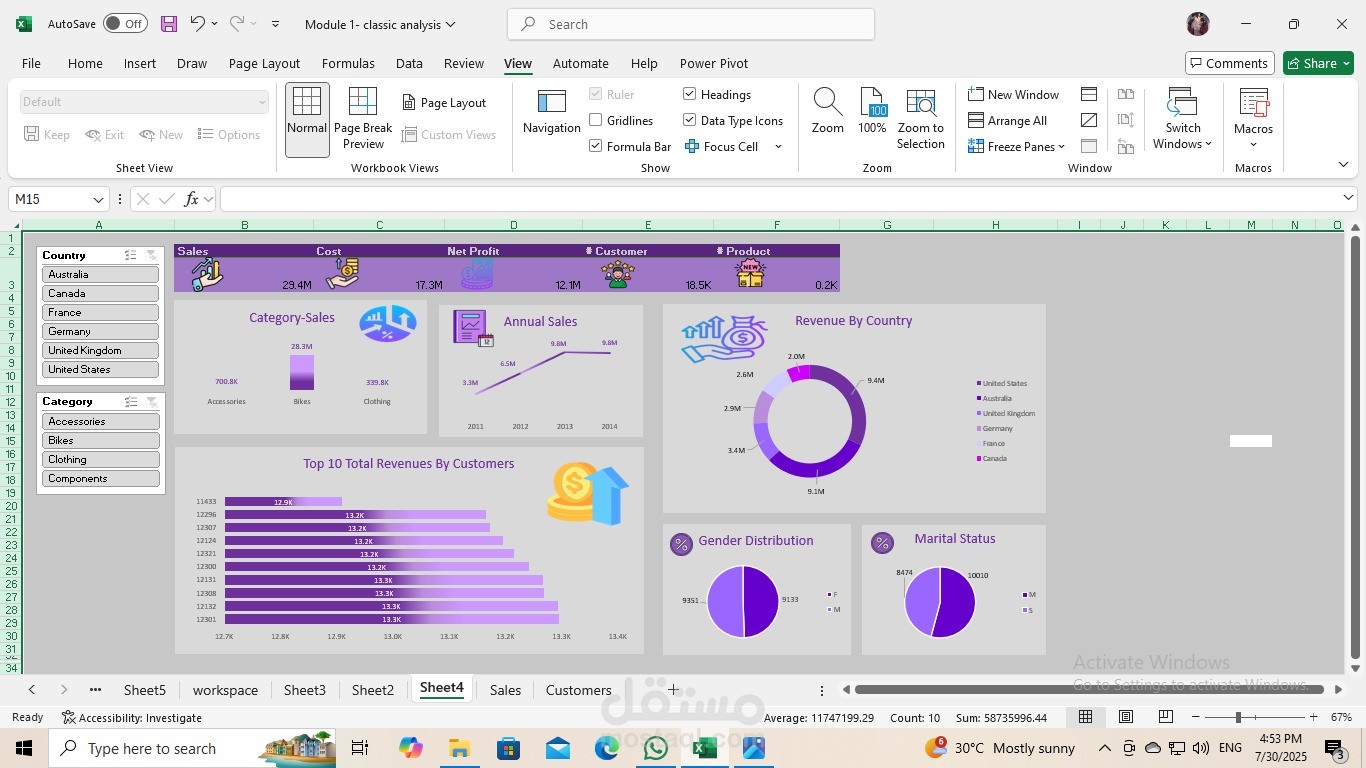
This dashboard provides a comprehensive overview of sales performance, customer insights, and revenue distribution across multiple dimensions. It was built in Excel using interactive slicers and dynamic visualizations to allow for easy data exploration.
Key Insights Displayed:
1. KPI Summary (Top Panel)
Sales: Total sales revenue (29.4M).
Cost: Total costs (17.3M).
Net Profit: Remaining profit after costs.
Customer Count: Number of unique customers (12.1M).
Products Sold: Total products sold (18.5K).