Data analysis project using Excel
تفاصيل العمل

Analysis of fuel station orders, Total Energy data, and Leader Group company name for the period from January to December 2024 .
Using Excel
- Get all data from Total Energy website for work orders
- Financial details of Leader Group's expenses are not displayed due to their confidentiality and are replaced with percentages.
INSIGHTS
1- Total number of fuel stations: 17 stations divided into 3 categories
Premium With 5 stations 51% of total expenses
Standard With 3 stations 16% of total expenses
Minimal With 9 stations 33% of total expenses
2-The maintenance engineers’ response to the work order depends on the arrival of a report on the company’s system. Therefore, the average response of the maintenance engineers to the report can be calculated. Here, an equation OR was used to set two conditions and divided them into true and false. In the case of true, it requires site-specific approvals, and in the case of false, it does not require approvals. Therefore, the average will be calculated on false .
AVG response = 1,77 Day
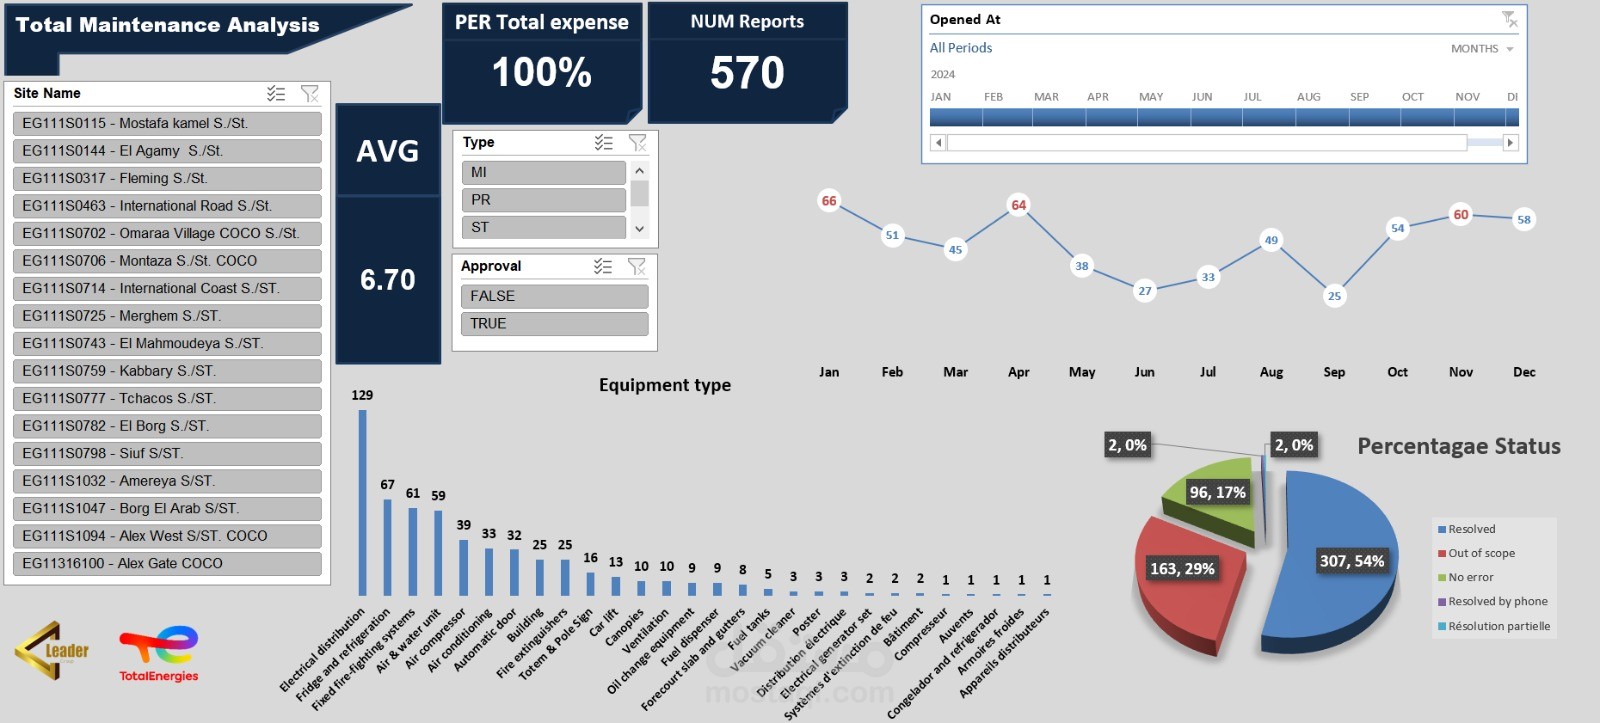
3- Total of work orders from January to December 2024
Total = 570 reports
4- Most reports in January total = 66 reports
Fewest reports in September total = 25 reports
5- Most of the reports came in the sections
Electrical distribution Department Total = 129 reports
Fridge and refrigeration Department Total = 67 reports
Fixed fire-fighting systems Department Total = 61 reports
6-The report is divided into cases
Resolved = 307 reports By 53.86 % Of the total report
Out Of Scoope (It needs approvals )
=163 reports By 28.60 % Of the total report
No error = 96 reports By 16.84 % Of the total report
Résolution partielle = 2 reports By 0.35 % Of the total report
Resolved by phone = 2 reports By 0.35 % Of the total report