Interactive K-Means Clustering Visualization with Streamlit
تفاصيل العمل
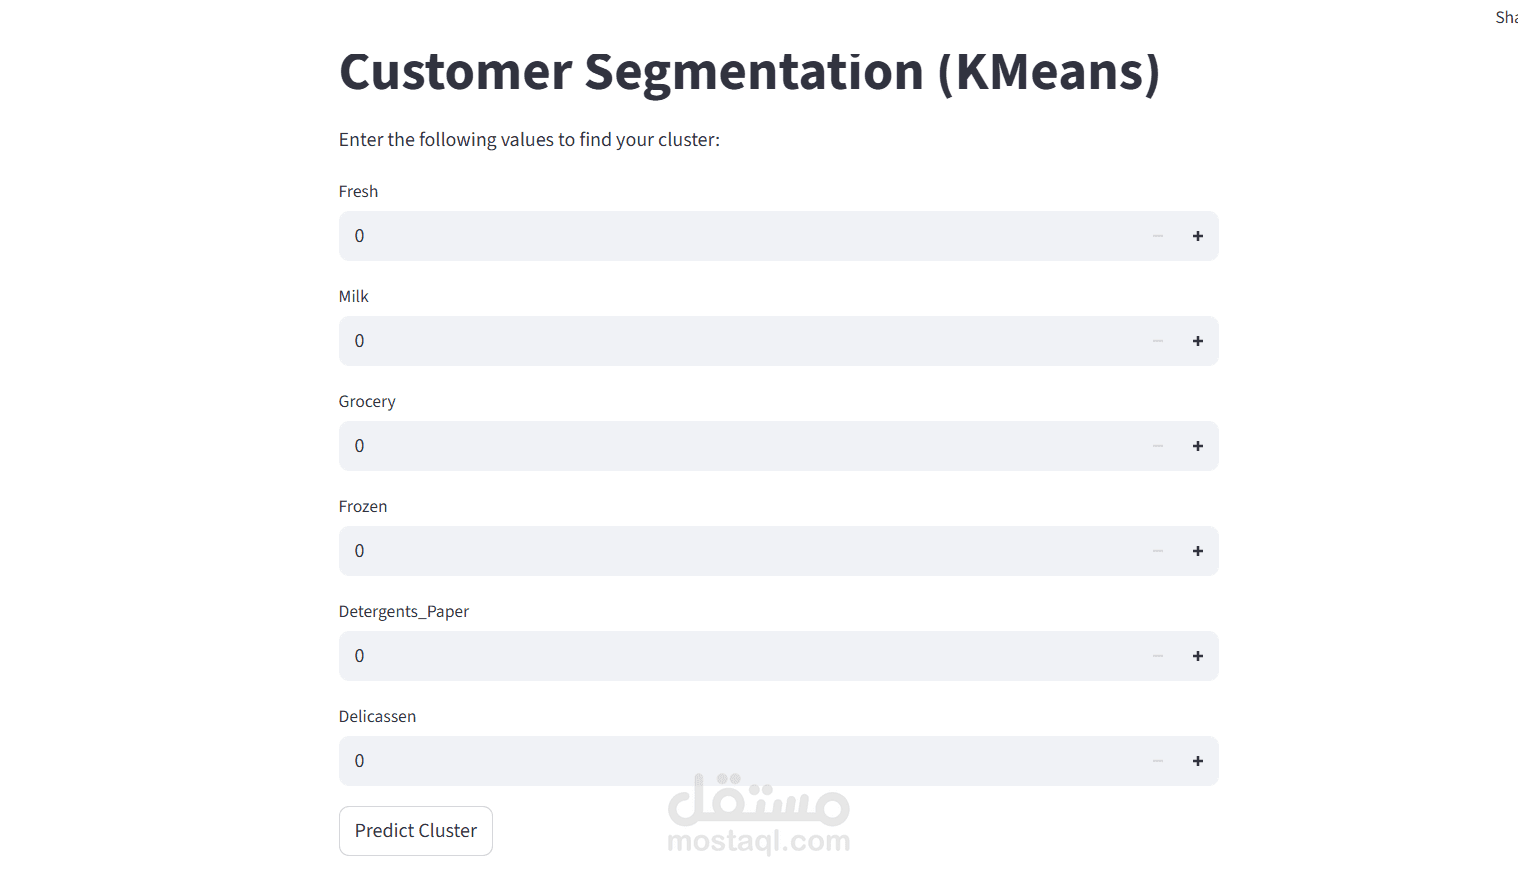
This project is an interactive machine learning web application built with Streamlit that demonstrates the inner workings of the K-Means clustering algorithm. It was designed as both a teaching tool and a practical exploration of unsupervised learning techniques.
Key features of the application include:
Dynamic Clustering: Users can upload datasets or use built-in examples to see how K-Means groups data into clusters in real time.
Customizable Parameters: The app allows adjustment of the number of clusters (k) and initialization settings, providing a hands-on way to explore how parameter choices affect results.
Interactive Visualizations: Data points are plotted with color-coded clusters, centroids, and step-by-step iterations, helping users visualize how the algorithm converges.
Educational Focus: Simplifies complex unsupervised learning concepts by allowing users to experiment with different datasets and instantly see the outcomes.
This project highlights practical skills in Python, scikit-learn, data visualization (Matplotlib/Seaborn), and Streamlit deployment. It serves as both a learning resource and a demonstration of clustering techniques widely used in data science.