SuperStore Sales
تفاصيل العمل
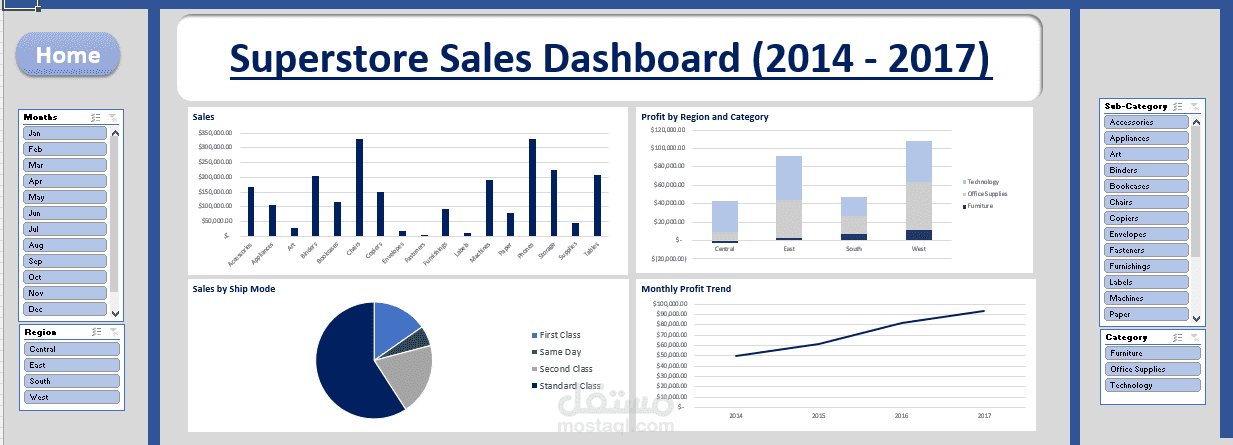
This Excel dashboard provides an overview of Superstore sales from 2014–2017, with breakdowns by region, category, and shipping mode. It
highlights sales trends, profit contributions, and performance comparisons across segments. The project demonstrates my ability to create
clear, interactive dashboards for business intelligence.