Orders Report
تفاصيل العمل
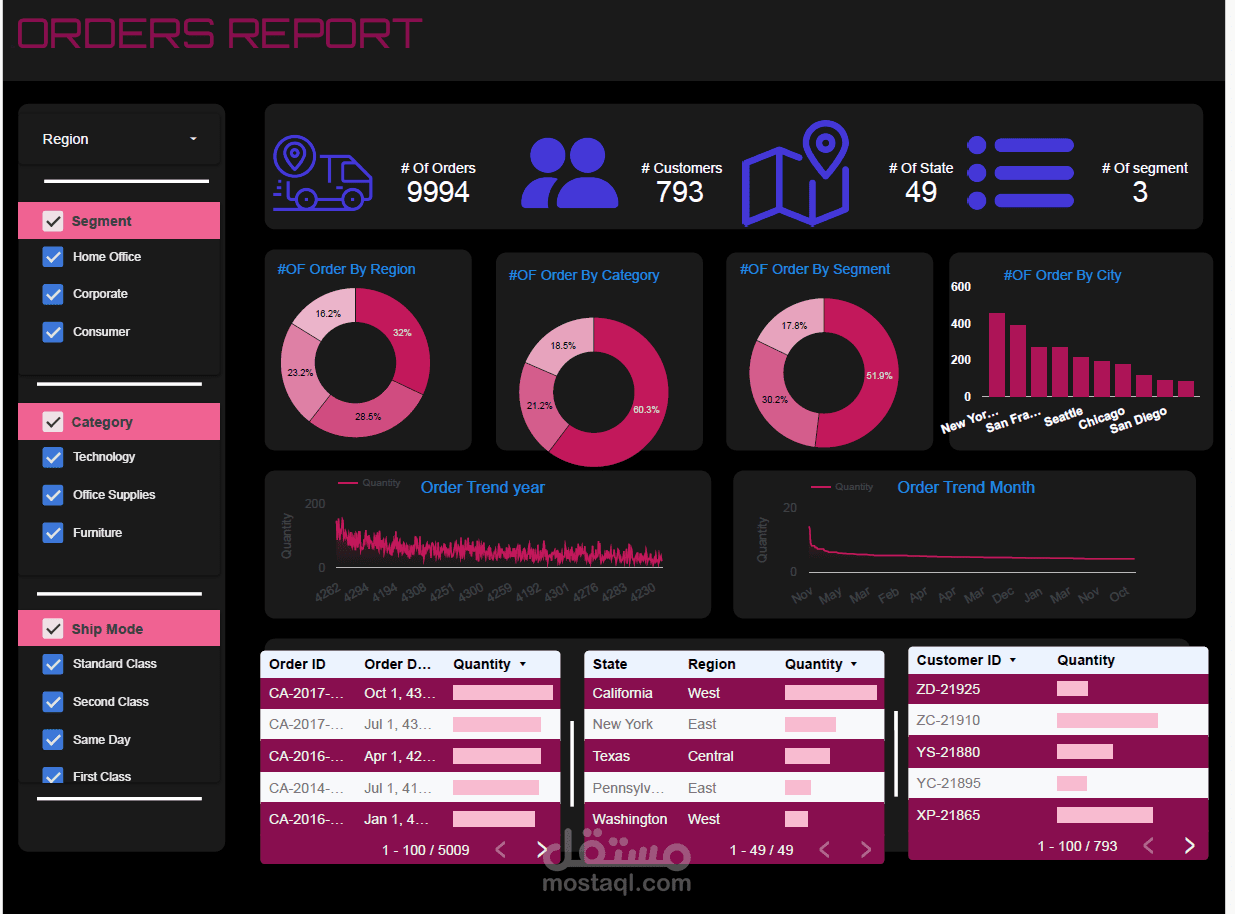
I built an interactive Power BI dashboard to analyze order data and provide insights into sales, customers, regions, and shipping modes.
Key Features:
Tracked 9,994 orders across 793 customers, spanning 49 states and 3 market segments.
Visualized orders by region, category, and customer segment using pie charts.
Highlighted top-performing cities (e.g., New York, San Francisco, Seattle).
Showed order trends by year and month to monitor sales performance over time.
Included filters for segment, category, and ship mode for dynamic exploration.
This dashboard demonstrates strong skills in data visualization, DAX measures, and storytelling with Power BI, making complex data easy to understand for business decisions.