Sales Report
تفاصيل العمل

هو تقرير تحليلي يُظهر أداء المبيعات داخل مؤسسة أو مشروع.
# Power BI Sales Dashboard
This project **Power BI dashboard** for analyzing sales data from an electrical products company.
It covers **data preparation, modeling, visualization, and advanced features** such as tooltips, bookmarks, security roles, and a mobile-friendly view.
---
## Steps
### 1. Launch Power BI & Load Data
- Open **Power BI Desktop**
- Import the file `sales_2.csv` into **Power Query**
- Check **data types and quality** using the built-in tools:
- Column quality
- Column distribution
- Column profile
- Ensure correct data types are applied
- Rename columns with explicit labels:
| Original column | New name |
|-----------------|-----------|
| OrderID | Order Id |
| CustomerID | Customer Id |
| CompanyName | Customer Name |
| ProductID | Product Id |
| ProductName | Product Name |
| Category | Product Category |
| RegionID | Region Id |
| RegionName | Region Name |
| OrderDate | Order Date |
| Quantity | Quantity |
| UnitPrice | Unit Price |
| TotalPrice | Total Price |
| OrderStatus | Order Status |
---
### 2. Data Normalization
- Create **reference tables**:
- **Customers** (Customer Id, Customer Name)
- **Products** (Product Id, Product Name, Product Category)
- **Regions** (Region Id, Region Name)
- Remove duplicates, sort by IDs, and check anomalies
- Create a **Sales** fact table from the raw dataset
- Load only **Customers, Products, Regions, Sales** into the model
---
### 3. Data Model
- In **Model View**, check auto-generated relationships
- Example: *Sales ↔ Customers (Customer Id)*
- Validate relationships (e.g., Order Id with Product Name)
- Delete and recreate one relation manually to test
---
### 4. Dashboard Creation
#### Theme & Layout
- Import a custom theme (e.g., **Loomy Lime Theme**)
- Page settings:
- Height: **2000 px**
- Background: `#1E2D38`
- Tiles: `#232448`
- Arrange visuals using a predefined layout
#### DAX Measures
```DAX
Total Sales = SUM(Sales[Total Price])
Order Count = DISTINCTCOUNT(Sales[Order Id])
Quantity Sold = SUM(Sales[Quantity])
Average Order Value = DIVIDE([Total Sales], [Order Count])
```
---
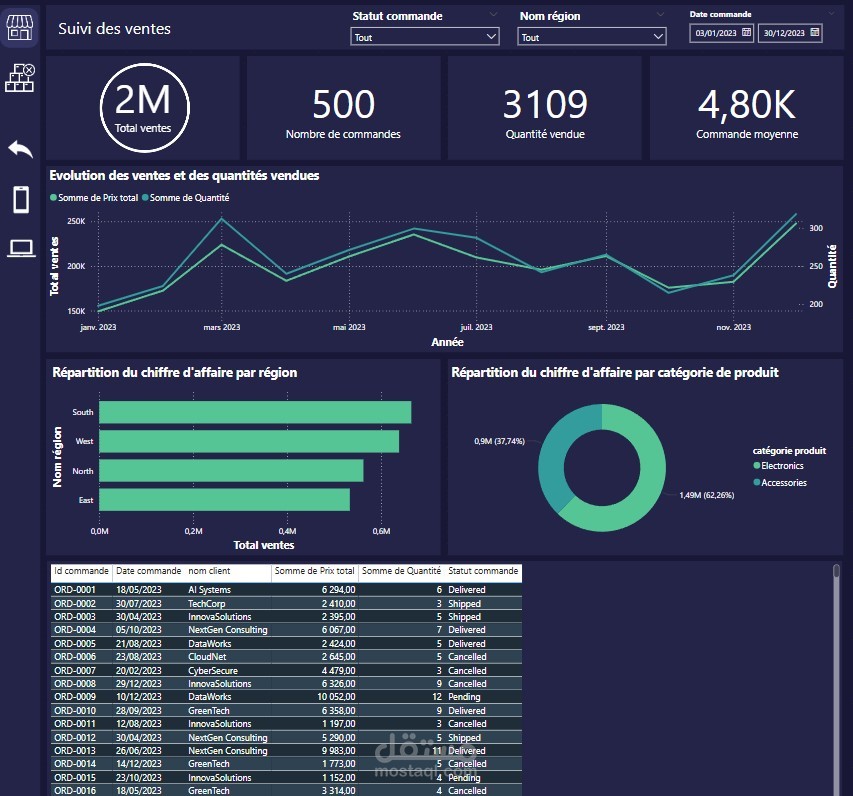
### Visuals – Page 1 (Sales Overview)
- **KPIs:** Total Sales, Order Count, Quantity Sold, Average Order Value
- **Line/Area chart:** Sales & quantity over time
- **Bar chart:** Sales by Region
- **Donut chart:** Sales by Product Category
- **Table:** Detailed orders (Order Id, Customer, Product, etc.)
#### Filters
- Date range
- Order status
- Region
---
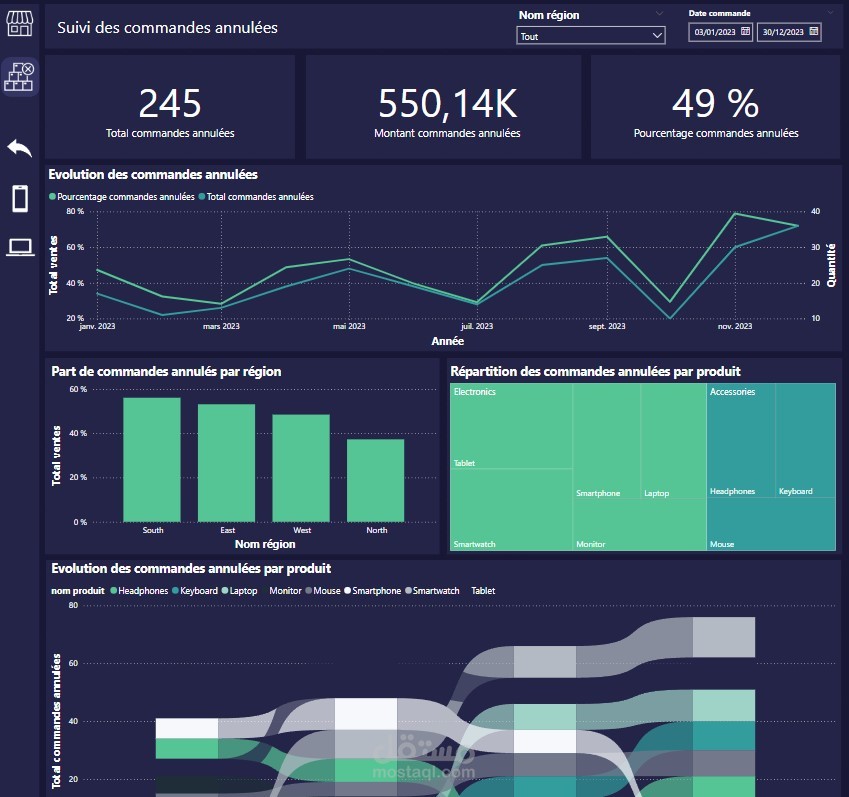
### 5. Second Page – Cancelled Orders
#### New Measures
```DAX
Cancelled Orders =
CALCULATE(COUNT(Sales[Order Id]), Sales[Order Status] = "Cancelled")
Cancelled Sales =
CALCULATE(SUM(Sales[Total Price]), Sales[Order Status] = "Cancelled")
Cancelled % =
DIVIDE([Cancelled Orders], [Order Count])
```
#### Visuals
- **KPIs:** Cancelled Orders, Cancelled Sales, Cancelled %
- **Line chart:** Cancelled % over time
- **Column chart:** Cancelled Orders by Region
- **Treemap:** Cancelled Sales by Product/Category
- **Ribbon chart:** Cancelled Orders by Product per quarter
---
### 6. Navigation Menu
- Add custom icons to the left panel
- Link each icon to report pages
---
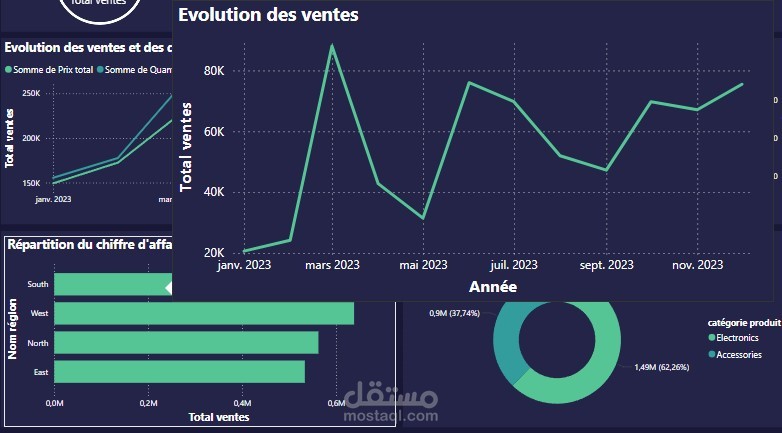
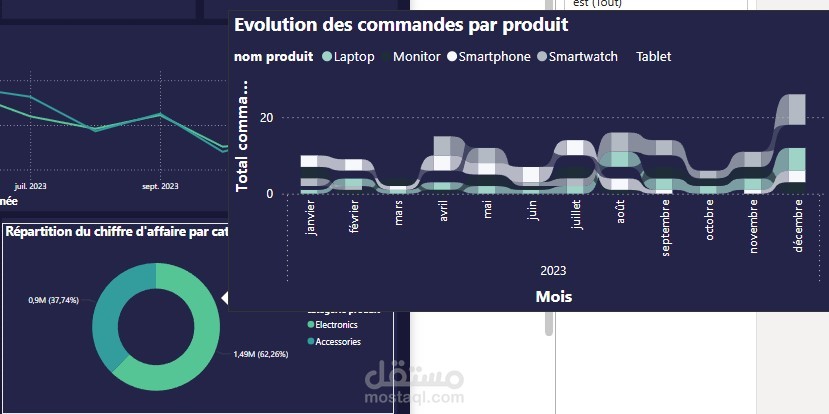
### 7. Tooltips
- **Region Histogram:** show sales evolution (line chart)
- **Category Donut:** show product evolution (ribbon chart)
---
### 8. Advanced Features
- **Data availability %:** with *PayPal KPI Donut Chart*
- **Bookmarks:**
- Mobile products (Smartphone, Headphone, SmartWatch)
- Office products (Tablet, Monitor, Laptop, Keyboard, Mouse)
- Reset filters
- **Row-Level Security (RLS):**
- Role 1 → only “AI Systems” & “TechCorp”
- Role 2 → only “South” region
- **Mobile layout:** adapt *Sales Overview* for mobile
---
### 9. Publish
- Save `.pbix` file
- Publish to **Power BI Service** for sharing
---
## Screenshots (Example)
_Add your Power BI report screenshots here_
- Sales Overview Page
- Cancelled Orders Page
- Navigation Menu
---
## Final Result
You now have a fully functional **Power BI Dashboard** with:
- Clean & normalized data model
- Multiple analysis pages
- KPIs, charts, filters, tooltips
- Navigation menu & bookmarks
- Security roles
- Mobile-friendly version