Global Temperature Analysis
تفاصيل العمل
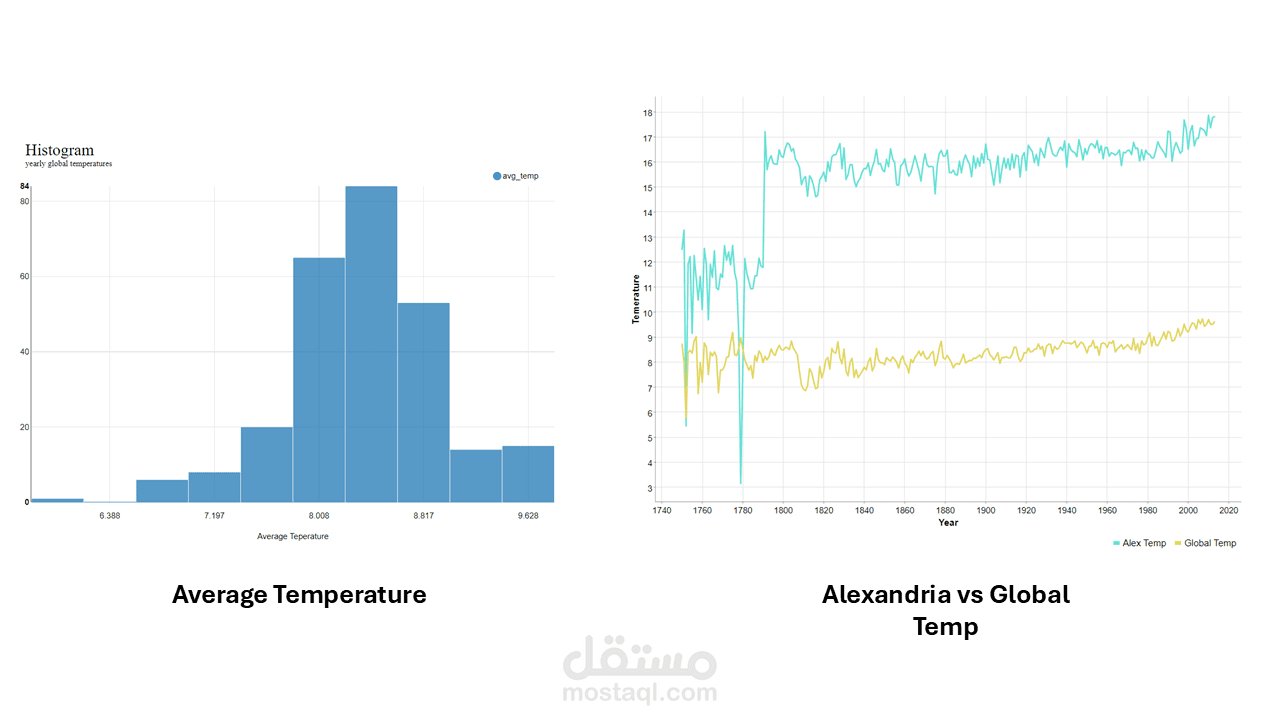
This project solves a real-world data analytics case using the KNIME platform, focusing on temperature trends across countries over the past 270 years.
Objectives
The task involved using two datasets (city and global temperature data) to:
Compute country-wise temperature averages
Classify countries by temperature range
Compare country averages to global temperature trends
Identify outliers
Visualize distributions and city-global comparisons
Tools Used
KNIME Analytics Platform
Data Sources: Provided city and global temperature CSVs
Nodes Used: GroupBy, Row Filter, Joiner, Math Formula, Numeric/Auto Binner, Histogram, Line Plot