HR Dashboard – Power BI Project
تفاصيل العمل
HR Dashboard – Power BI Project
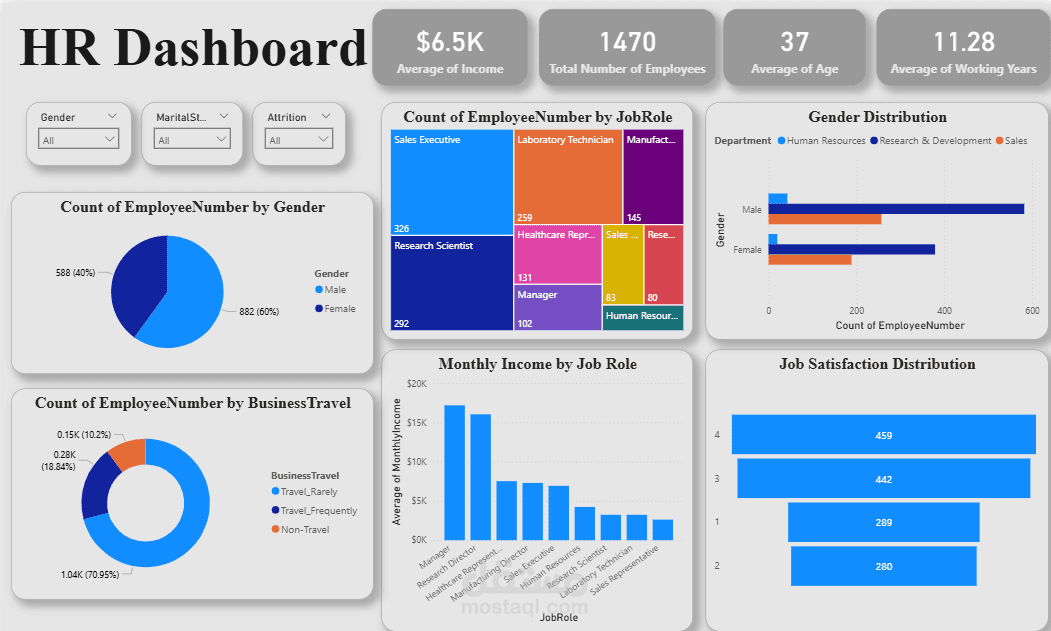
This interactive HR Dashboard was developed using Power BI to provide a clear overview of employee demographics, job roles, income levels, and satisfaction rates. Power Query was utilized for comprehensive data cleaning, transformation, and integration before visualization.
Key Insights & Features:
Workforce Overview: Displays KPIs such as total employees (1,470), average monthly income ($6.5K), average age (37), and average years of service (11.28).
Employee Demographics:
Gender distribution (60% male, 40% female).
Department-wise gender breakdown for HR, R&D, and Sales.
Job Role Analysis:
Treemap visualization showing employee count by job role.
Monthly income comparison across different job roles.
Business Travel Patterns: Breaks down employees into Travel Rarely, Travel Frequently, and Non-Travel categories.
Job Satisfaction Analysis: Distribution of satisfaction scores from 1 to 4.
Interactivity: Includes slicers for Gender, Marital Status, and Attrition for dynamic filtering and deeper analysis.
Data Processing:
Cleaned and transformed raw HR data using Power Query.
Ensured data accuracy and consistency before loading into Power BI for visualization.
Impact:
This dashboard helps HR departments monitor workforce composition, understand pay and satisfaction trends, and support data-driven decision-making in employee management and retention strategies.