Uber Trip Analysis Dashboard
تفاصيل العمل
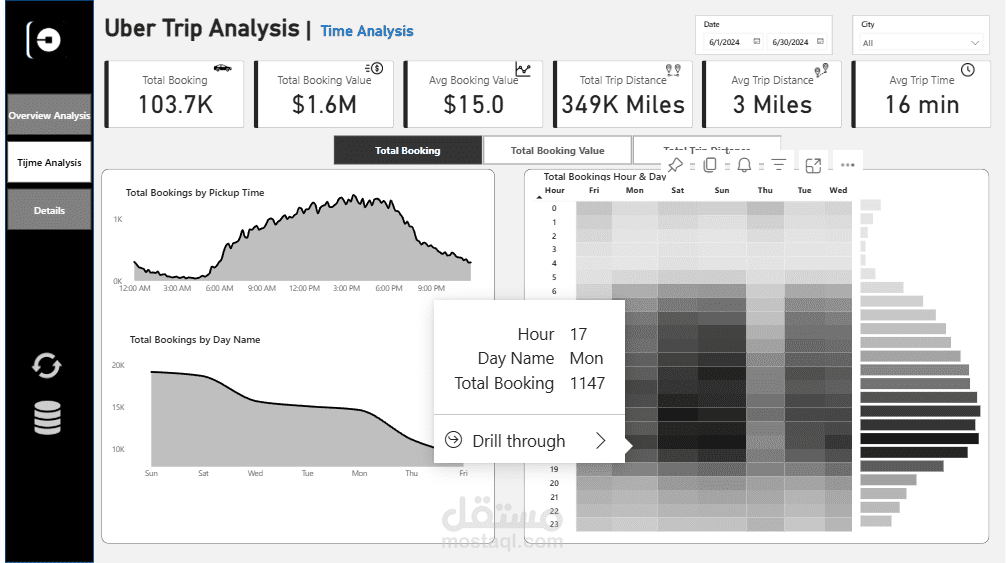
داش بورد بpower bi عالي الجودة
:Uber Trip Analysis Dashboard, created in Power BI as part of my final project with
This sleek, interactive dashboard dives deep into Uber trip data, offering actionable insights to boost operations, pricing strategies and help desicion making ,all driven by comprehensive KPIs:
KPIs & Insights:
1️⃣ Total Bookings: Analyze trip demand trends (e.g., 103.7K trips)
2️⃣ Total Booking Value: Track revenue performance ($1.6M)
3️⃣ Average Booking Value: Identify per-trip profitability ($15)
4️⃣ Total Trip Distance: Assess mileage scale (349K Miles)
5️⃣ Average Trip Distance: Understand typical travel patterns (3 Miles)
6️⃣ Average Trip Time: Gauge trip efficiency (16 min)
Key Insights & Features:
Rush Hour Demand :
Morning rush (7 AM–9 AM): Strong demand as commuters head to work
Evening rush (5 PM–7 PM): Peak activity as people return home
Both periods highlight opportunities to adjust pricing or driver allocation
Payment Analysis :
Uber Pay dominates with 67% of total bookings, followed by Cash (32%)
Trip Type Trends ️ :
Day trips account for 56% of rides, while night trips make up 44%.
Vehicle Performance :
UberX leads with 38.7K trips, showcasing the highest demand among all vehicle types.
Location Analysis :
Most Frequent Pickup Point: Penn Station/Madison Sq West.
Most Frequent Drop-off Point: Upper East Side North.
Farthest Trip: 144.1 miles (Lower East Side to Crown Heights North).
Shortest Trip: 1 mile (Murray Hill to Midtown Center).
⏱ Time-Based Insights:
Peak Hours: Demand surges between 9 AM - 3 PM, with significant spikes during morning and evening rush hours.
Weekly Patterns: Weekends observe higher booking volumes, driven by leisure and social travel
Demand Heatmap: Mondays at 5 PM are peak booking periods, showcasing weekday rush activity
Interactive Features ? :
Dynamic measure selectors for Total Bookings, Revenue, and Trip Distance.
Drill-through functionality for granular trip exploration in the Details Tab.
Tooltips for extra insights, slicers for quick filtering, and conditional formatting for trend detection
This dashboard bridges data and decision-making, offering powerful tools for Uber to optimize operations, allocate resources, and enhance rider satisfaction.