Mobile Sales Dashboard Insights
تفاصيل العمل
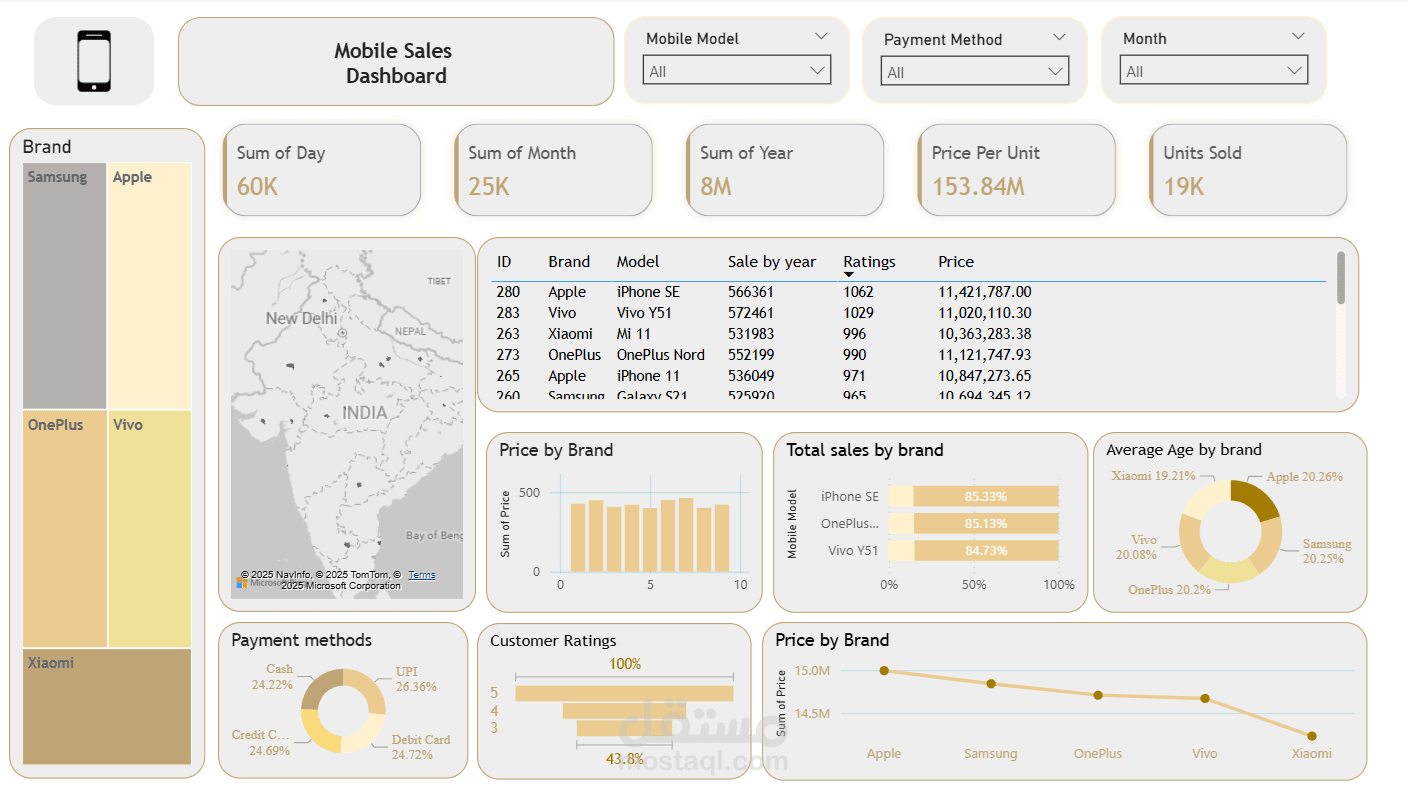
In this project, I designed and developed an interactive dashboard in Power BI to analyze mobile sales data, visualize key metrics, and uncover actionable insights to support data-driven decisions.
KPIs Tracked:
Daily, Monthly & Yearly Sales
Total Revenue & Average Price Per Unit
Units Sold
⭐ Customer Ratings
Filters (Slicers):
Mobile Model
Payment Method
Month
Brand
Tools & Techniques:
Power Query – Data cleaning & preparation
Data Modeling – Building relationships & measures
DAX – Calculations for KPIs & metrics
Power BI Visuals—Charts, Maps & Interactive Dashboards
Outcome:
Delivered a professional and interactive dashboard that provides a clear overview of sales performance, highlights brand-wise insights, visualizes customer behavior, and supports smarter business decisions.