Netflix Insights Dashboard
تفاصيل العمل
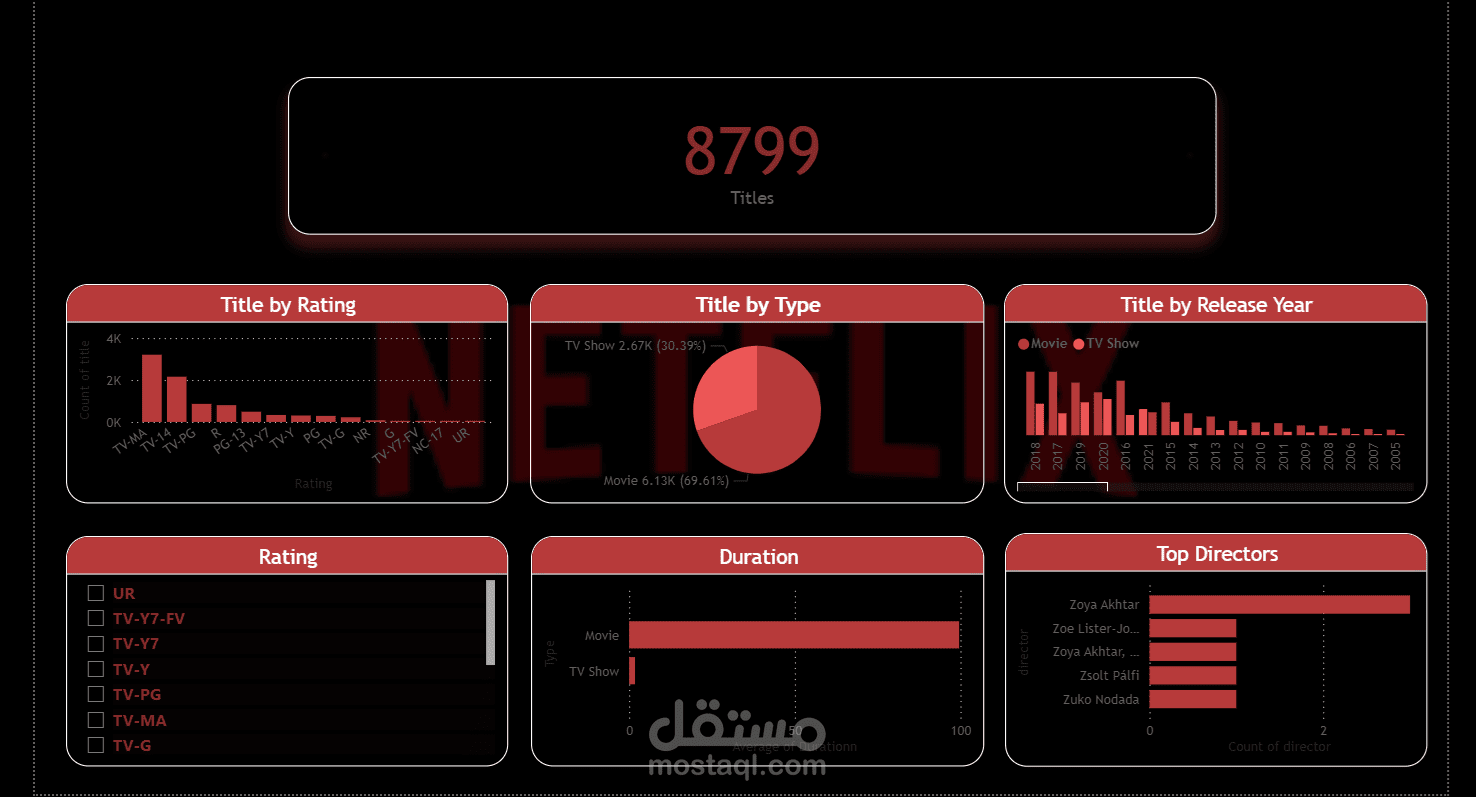
In this project, I designed and developed an interactive dashboard in Power BI to analyze Netflix's content library and uncover viewing and production trends.
KPIs Tracked:
Total Titles
⭐ Content Ratings Distribution
Titles by Release Year
Titles by Type (Movies vs TV Shows)
Filters (Slicers):
Rating
Release Year
Tools & Techniques:
Power Query – Data cleaning & transformation
Data Modeling – Relationships & calculations with DAX
Power BI Visuals—Interactive charts & insights
Outcome:
The dashboard provides a clear overview of Netflix's library, highlights content trends over time, and identifies top-rated directors—offering valuable insights for content strategy and decision-making.