Dashboard (Patient Diagnosis & Lab Insights)
تفاصيل العمل
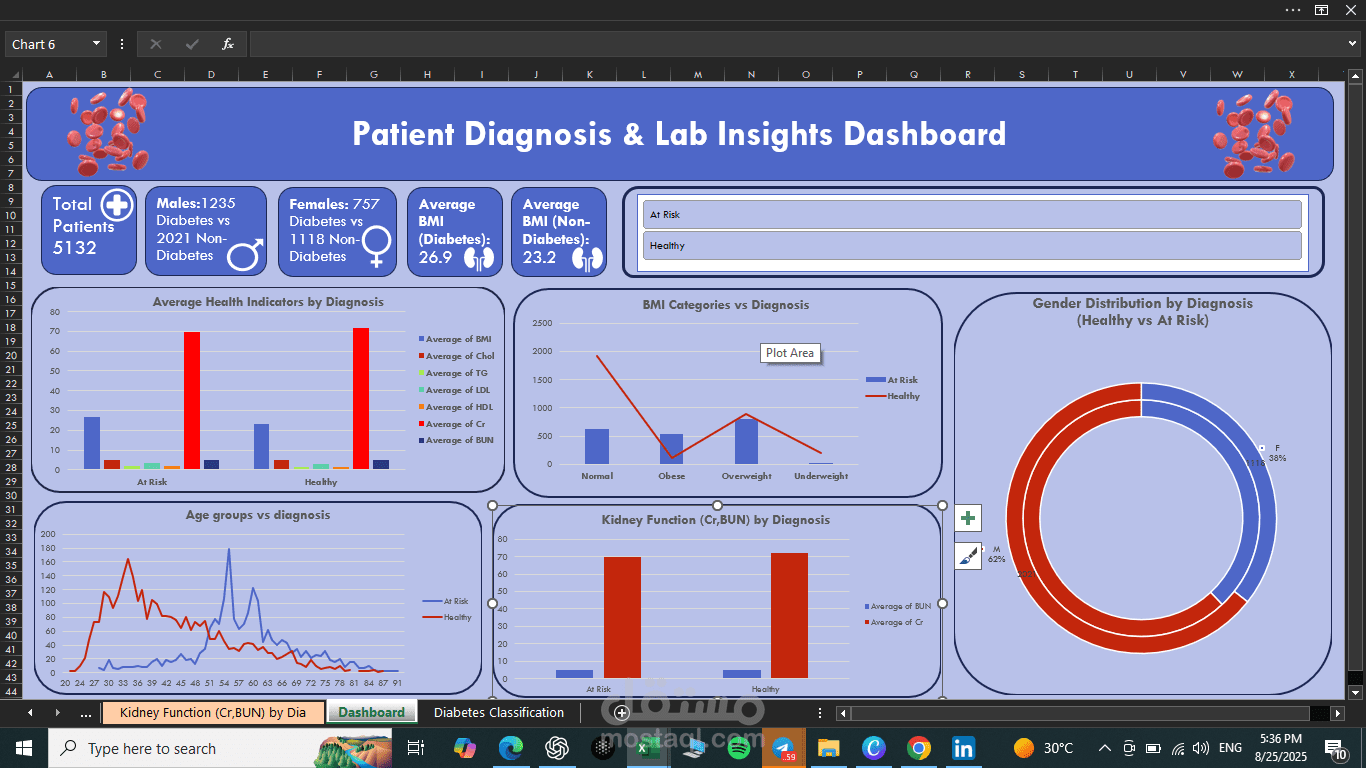
The dataset included key medical variables such as Age, Gender, BMI, Cholesterol, Triglycerides, HDL, LDL, Creatinine, BUN, and Diagnosis.
Through PivotTables, Slicers, and interactive charts, I was able to:
• Visualize patient distribution by status, gender, and age groups.
• Compare averages of key health indicators (Chol, LDL, HDL, TG, BMI) across different patient categories.
• Highlight kidney function measures (Creatinine & BUN) by patient status.
• Provide KPI Cards for quick insights: total patients,Male and Female Diabetes vs Non-Diabetes , average BMI for Diabetes and Non-Diabetes.