Jobs Salary Analysis Dashboard (Data Analysis & Visualization)
تفاصيل العمل
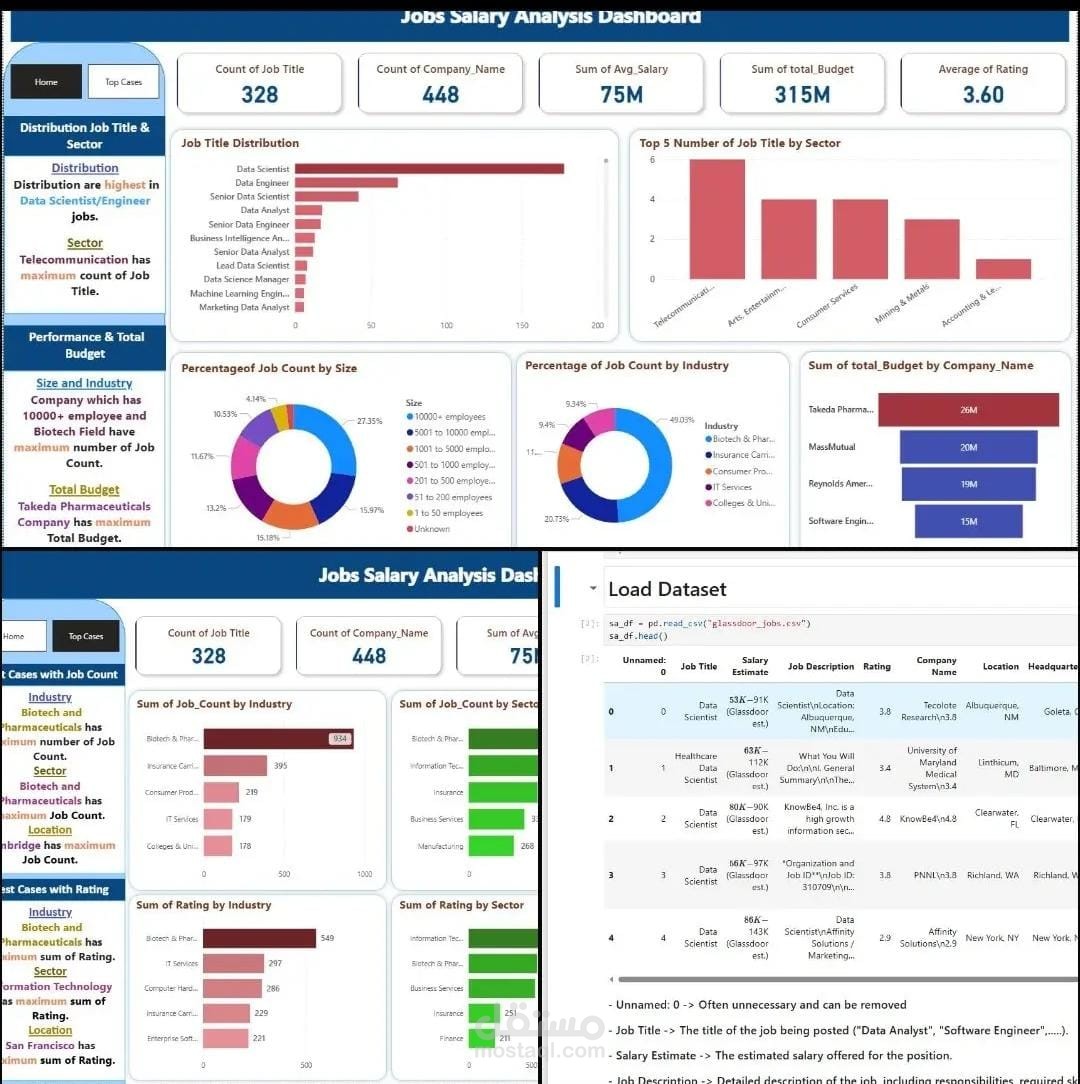
This project focuses on analyzing job salary data across multiple industries and companies. Using Python (Pandas, Matplotlib, Seaborn, Excel) for data cleaning and preprocessing, and Power BI for visualization, I built an interactive Jobs Salary Analysis Dashboard.
Key features include:
Job Title Distribution: Breakdown of roles such as Data Scientist, Senior Data Engineer, Business Intelligence Analyst, etc.
Salary Insights: Average salary estimates, budget allocation per company, and salary distribution by sector.
Company & Industry Analysis: Number of jobs by company size, sector, and industry type.
Performance & Ratings: Average rating of companies and comparison across different industries.
Top Companies: Highlighting organizations with the highest job counts and budgets.
The dashboard provides clear, data-driven insights for understanding salary trends, industry demands, and company performance, supporting decision-making for job seekers, recruiters, and HR teams.