Wallmart BI
تفاصيل العمل
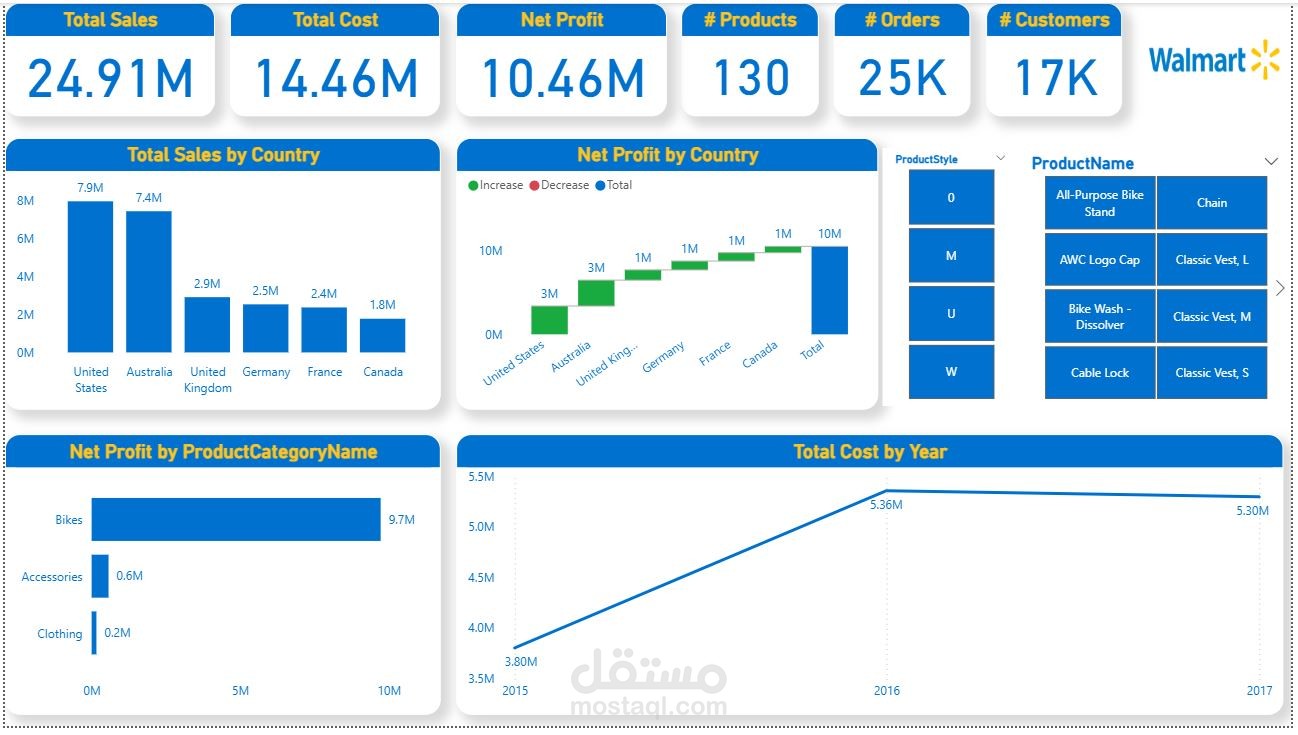

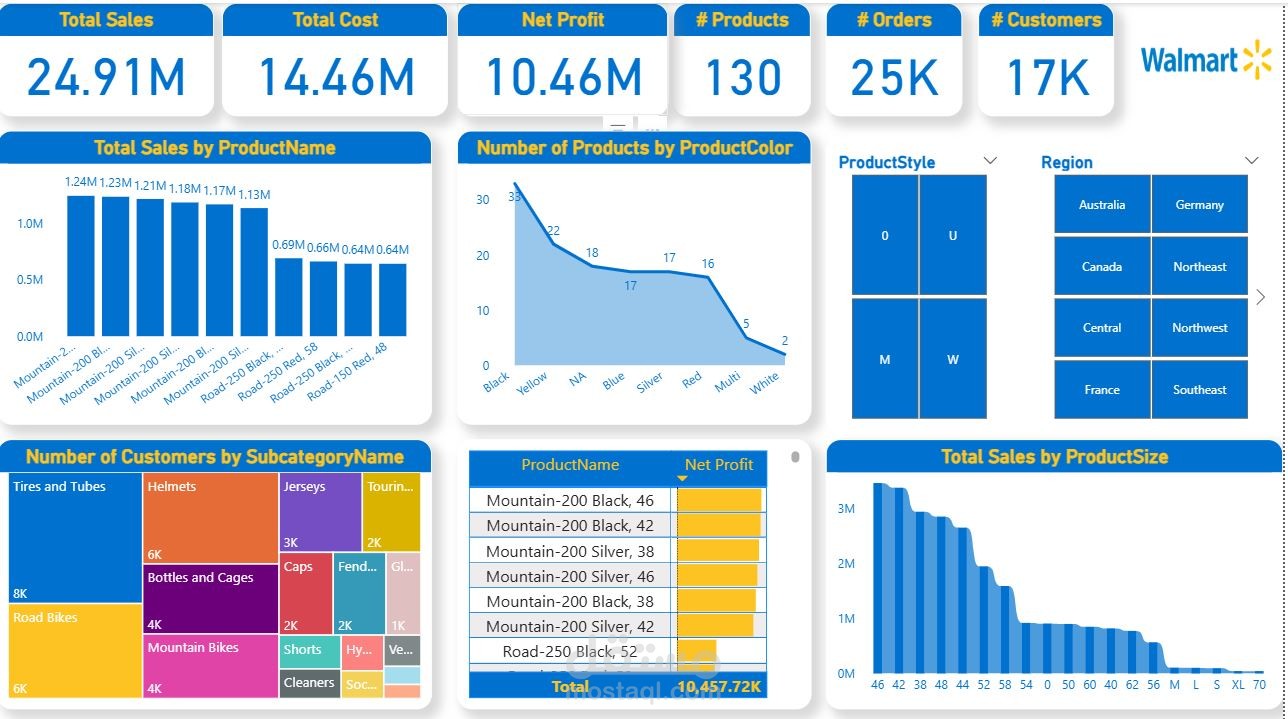
5-Make a Dynamic Dashboard by using at least 5 unique charts:
- Total Sales Per Customer Country
- Average Sales per Gender
- Number of customers per Product Brand
- Number of products per marital status
- Total QTY Per Year
- Total Profit Per Month
- Average Cost Per Brand
- Total sales per Store type
- Number of Customers per store City
- Net profit Per sales district