Call center company insights
تفاصيل العمل
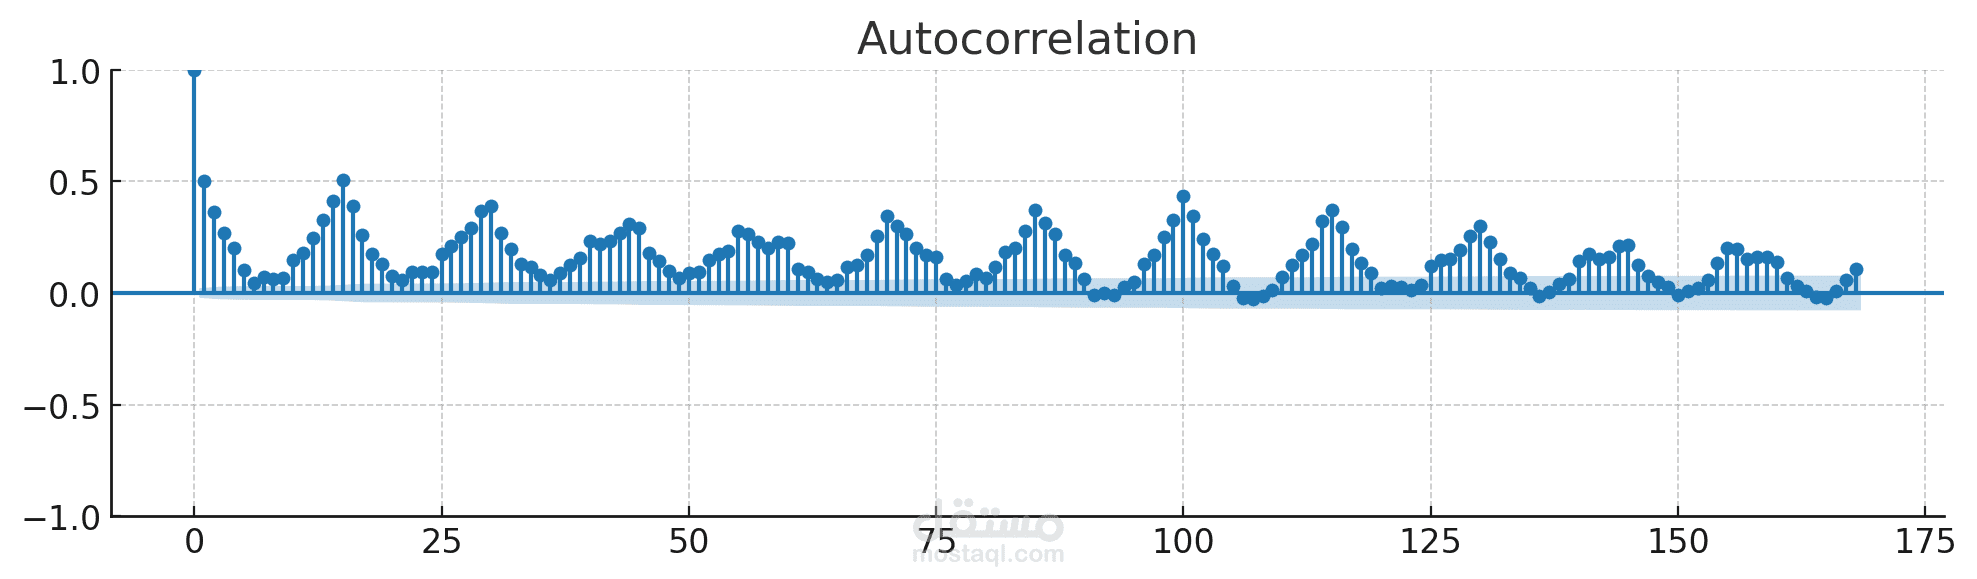
•This is an autocorrelation function (ACF) plot, which measures the correlation of a time series with its own lagged values.
•On the x-axis, we have the lag values (from 0 up to ~175).
•On the y-axis, the autocorrelation values range between -1 and 1.
•At lag 0, the autocorrelation is 1, as expected (a series is perfectly correlated with itself at zero lag).
•The plot shows repeating peaks around lags of ~24, ~48, ~72, etc., which suggests the data has a strong daily seasonality (24-hour cycle).
•The values remain positive at many lags, with significant spikes above the confidence interval (the shaded band around 0), meaning the seasonality is statistically significant.